A Snowflake pipeline can finish successfully while the data underneath is incomplete, duplicated, or stale. The dashboard still loads, the SQL still runs, and the problem may remain invisible until a finance leader, clinician, or operations manager questions a number.
That's why Snowflake data quality needs to operate as more than a collection of row-level queries. The practical challenge is moving from isolated checks on important tables to an account-wide operating model that shows coverage, incidents, ownership, and trends. Snowflake's native profiling, Data Metric Functions, expectations, Snowsight monitoring, and emerging AI-suggested checks provide the pieces. Teams still need to decide how those pieces work together in production.
When Bad Snowflake Data Quietly Breaks Your Reports
A healthcare analytics team had a quarterly executive dashboard that tracked patient activity across facilities. The Snowpipe ingestion process appeared healthy, but one load skipped a null partition. The affected records didn't trigger a pipeline failure, so the reconciliation job proceeded against data that was already incomplete.
The dashboard showed inflated patient counts. The immediate cause wasn't a broken query. It was a combination of missing partition data, duplicate records from a retry path, and freshness signals that didn't make the stale portion of the dataset obvious. By the time analysts identified the discrepancy, executives had already used the dashboard in operational discussions.
That failure pattern is common because each individual system can look healthy:
- Ingestion reports success: Files arrived and were processed, but one logical slice of the data was absent.
- Freshness appears acceptable: The table changed recently, even though the newest data didn't represent the complete source.
- Reconciliation runs normally: The job validates the output it receives, not the records that never arrived.
- The dashboard executes: SQL can return a plausible result from invalid inputs.
Practical rule: A green pipeline status proves that processing completed. It doesn't prove that the resulting data is complete, unique, timely, or fit for its business purpose.
In finance, the equivalent failure may involve duplicated settlement records. In IoT, a sensor table can continue receiving rows while one device stops reporting. In healthcare, a missing partition can distort measures that influence staffing, utilization, or compliance reporting. The downstream cost is difficult to isolate because the first visible symptom often appears far from the ingestion point.
The solution isn't to write a custom query for every possible failure. It's to create repeatable measurements, apply explicit expectations, schedule them against the right assets, and make account-wide coverage visible. The rest of the operating model depends on that foundation.
The Building Blocks of Snowflake Data Quality
Snowflake's native quality framework starts with Data Metric Functions, or DMFs. A DMF measures a property of a table, view, or column and returns a result that teams can monitor over time. Snowflake provides system DMFs for common checks, while custom DMFs let engineers encode domain-specific rules in SQL.
System checks include NULL_COUNT, NULL_PERCENT, DUPLICATE_COUNT, UNIQUE_COUNT, FRESHNESS, ROW_COUNT, BLANK_COUNT, and ZERO_PERCENT. Snowflake's profiling capability also gathers statistics such as row counts, null counts, minimum and maximum values, common values, distributions, and uniqueness, with no setup required according to its data quality profiling documentation.
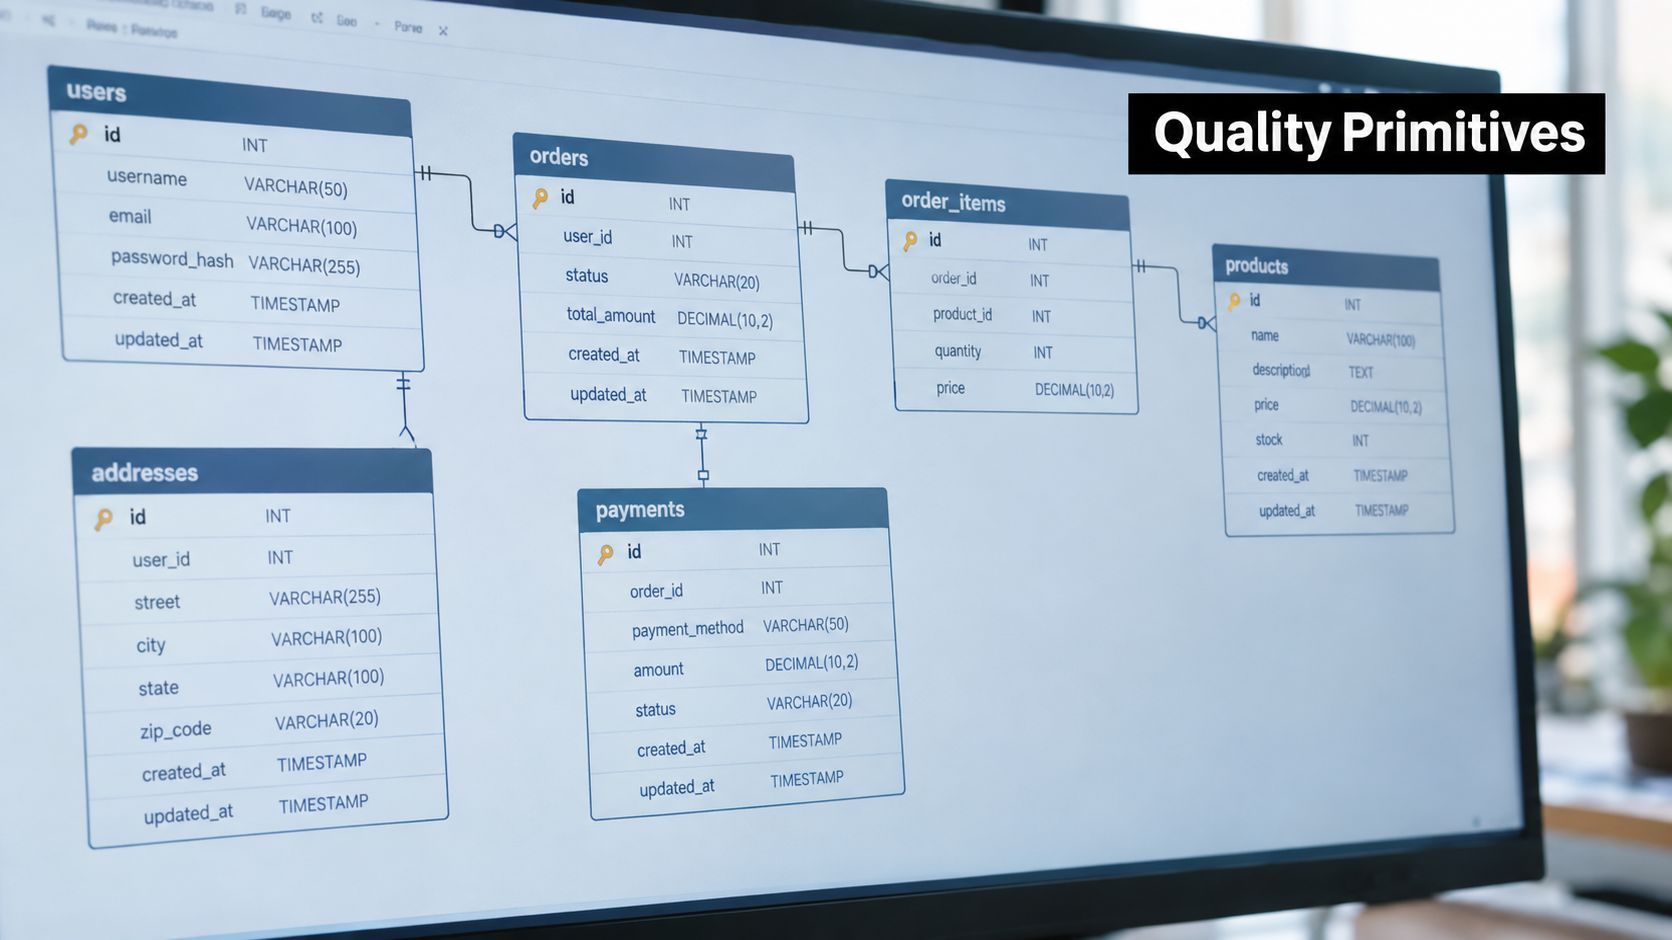
Separate measurement from policy
Suppose CUSTOMER.EMAIL must be populated. A system DMF can measure the null count. An expectation converts that measurement into a rule, such as an expression requiring the value to equal zero. Snowflake defines an expectation as violated when its expression evaluates to FALSE; a NULL evaluation means the expectation check itself failed, as described in the Snowflake data quality introduction.
That separation matters. The DMF answers, “What did we measure?” The expectation answers, “Does this result meet our policy?” You can reuse the same measurement with different thresholds for optional, operational, and regulated fields.
A custom DMF becomes appropriate when the rule depends on business meaning. Examples include checking whether a settlement record reconciles with a confirmation record, whether an IoT event falls within an allowed operating window, or whether a healthcare record contains an approved classification.
Make the check operational
A production check needs four parts:
- The metric: Choose a system DMF or create a custom one.
- The association: Attach it to the relevant table, view, or column.
- The expectation: Define the expression that marks the result healthy or violated.
- The schedule: Run it after the upstream data should be available.
Snowflake exposes results through a dedicated event table, the DATA_QUALITY_MONITORING_RESULTS view, and the DATA_QUALITY_MONITORING_RESULTS table function, which returns one row per DMF result. That gives engineers several ways to build operational views without relying only on Snowsight.
Good physical modeling still helps quality programs. Teams designing or reviewing schemas should pair monitoring with practical database normalization and security tips, especially where duplicated attributes or weak access boundaries make quality failures harder to diagnose.
Choosing Your Quality Stack
No single testing layer handles every quality problem well. Native DMFs, dbt tests, and Great Expectations operate at different points in the data lifecycle, so the right choice depends on whether the team needs production monitoring, transformation validation, or portability across platforms.
CapabilityNative DMFsdbt TestsGreat ExpectationsBest fitOngoing checks on Snowflake tables and viewsAssertions during transformation workflowsPortable validation across data systemsTypical checksFreshness, volume, nulls, duplicates, uniquenessRelationships, accepted values, uniqueness, model assertionsRule-based and richer statistical expectationsSnowflake integrationNative associations, expectations, Snowsight monitoring, and result surfacesStrong transformation workflow integration, but separate from native DMF coverage unless connected deliberatelyDepends on deployment and integration designDeveloper experienceSQL and Snowflake administration skillsStrong model-centric workflow for analytics engineersFlexible validation framework with broader implementation choicesGovernance fitCentralized account visibility and table-level coverageGood ownership in code repositories and CI workflowsUseful for shared validation standards across platformsCost considerationsMonitoring execution and platform consumption need governanceRuns as part of transformation jobs and warehouse useDepends on execution environment and orchestrationMain limitationLess portable outside Snowflake and requires deliberate association managementCan miss drift between transformation runsRequires additional integration for Snowflake-native monitoring
Use native DMFs for steady-state production health
Native DMFs are a strong default for freshness, row count, null, duplicate, and uniqueness checks on large Snowflake tables. The checks live close to the data and can feed Snowflake's monitoring surfaces and result objects. That makes them useful for operational teams responsible for production tables, especially when freshness and volume failures need a central view.
They aren't a complete replacement for transformation tests. A DMF may identify that a production model contains duplicates, but a dbt test can stop or flag the transformation that created them before the model is published.
Keep dbt tests close to transformation logic
dbt works well when the test belongs with the model definition. Developers can review assertions alongside SQL changes, run them in CI, and connect failures to a deployment workflow. This is the right layer for model-specific relationships, accepted values, and transformation assumptions.
The trade-off is visibility. If dbt tests and DMFs are managed independently, leadership may see one set of checks in the transformation workflow and another in Snowsight. Teams should define which system owns each rule and avoid counting the same control twice.
Choose Great Expectations for portability
Great Expectations makes more sense when the organization validates data across Snowflake and other platforms, or when teams need a broader expectation vocabulary that shouldn't depend on one warehouse. The cost is operational integration. Engineers must decide how results, ownership, schedules, and incidents connect to Snowflake's monitoring model.
A practical maturity path is simple: start with native DMFs for critical production signals, add dbt tests where transformation failures should block publication, and introduce Great Expectations when cross-platform consistency justifies the extra operating layer.
Automating Checks with Streams, Tasks, and Snowpark
Continuous ingestion needs more than a batch query that runs after the day's load. Streams capture changes, Tasks schedule work, and Snowpark lets teams apply Python or other supported logic close to the data.
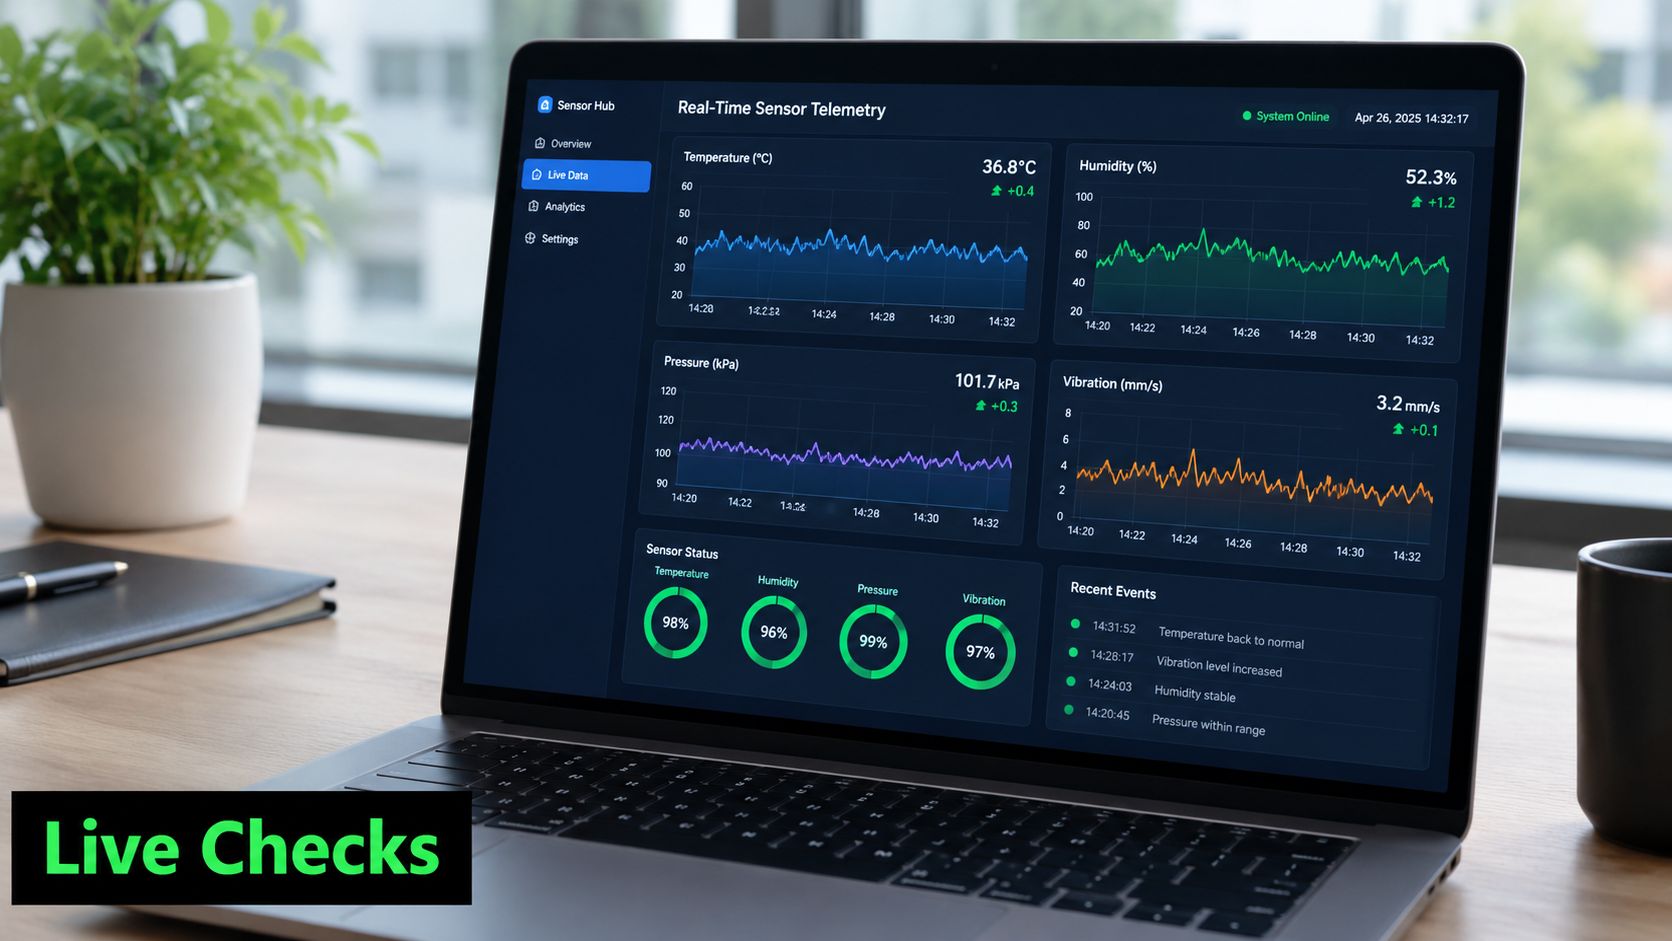
Consider an IoT estate with sensor readings arriving in RAW.SENSOR_READINGS. A stream records new inserts. A scheduled task invokes a Snowpark Python procedure that aggregates the latest window, evaluates freshness and a custom null-rate DMF, and writes violations to QUALITY.VIOLATIONS.
The pattern looks like this:
- Capture changes: Create a stream on the raw sensor table so the process can distinguish new data from previously processed rows.
- Schedule evaluation: Use a task aligned to the arrival pattern. A short interval can reduce detection latency, but it also increases orchestration activity.
- Apply checks: Use a system freshness metric for timeliness and a custom DMF for a sensor-specific null-rate rule.
- Persist actionable failures: Store the metric, asset, observed value, severity, and processing timestamp in a violations table.
- Notify an owner: Route only failures that have a defined response path.
The same architecture supports finance, but the trigger logic changes. Two streams can track ledger files and bank confirmations. A task should evaluate reconciliation only after both offsets advance, rather than reporting a false failure when one source is late.
A short demonstration can help engineers visualize how Snowflake orchestration and monitoring fit together:
Account for the operational trade-offs
High-frequency tasks need appropriately sized compute. A task that runs often against growing telemetry volumes can spend more time starting, scanning, and aggregating than teams expect. Snowpark on a dedicated compute pool can isolate workloads, but it introduces a separate cost and capacity decision compared with running the procedure on a standard warehouse.
Streams also require careful deduplication semantics. A change capture pattern tells you what changed, not whether the source emitted the same business event more than once. Your procedure still needs an event key, ordering logic, or reconciliation rule appropriate to the source.
Latency has a price: Faster detection can improve response time, but broader checks and more frequent execution increase compute and maintenance requirements. Set the cadence according to the business consequence of delay, not the theoretical speed of the platform.
Scaling from Tables to Account-Wide Governance
Table-by-table monitoring creates a familiar trap. Teams attach checks to the most visible assets, then assume quality coverage is broad because a few dashboards look healthy. Account-wide governance requires a separate measure of what is monitored, what is failing, and who owns the response.
Snowflake's centralized dashboard brings Data Profile and Monitoring views into Snowsight. The dashboard provides an account-wide summary of healthy and unhealthy tables and previews recent incidents. Snowflake documents monitoring coverage as the percentage of tables with at least one active DMF association. If an account has 1,000 tables and 100 are monitored, coverage is 10%, as explained in the centralized data quality dashboard documentation.
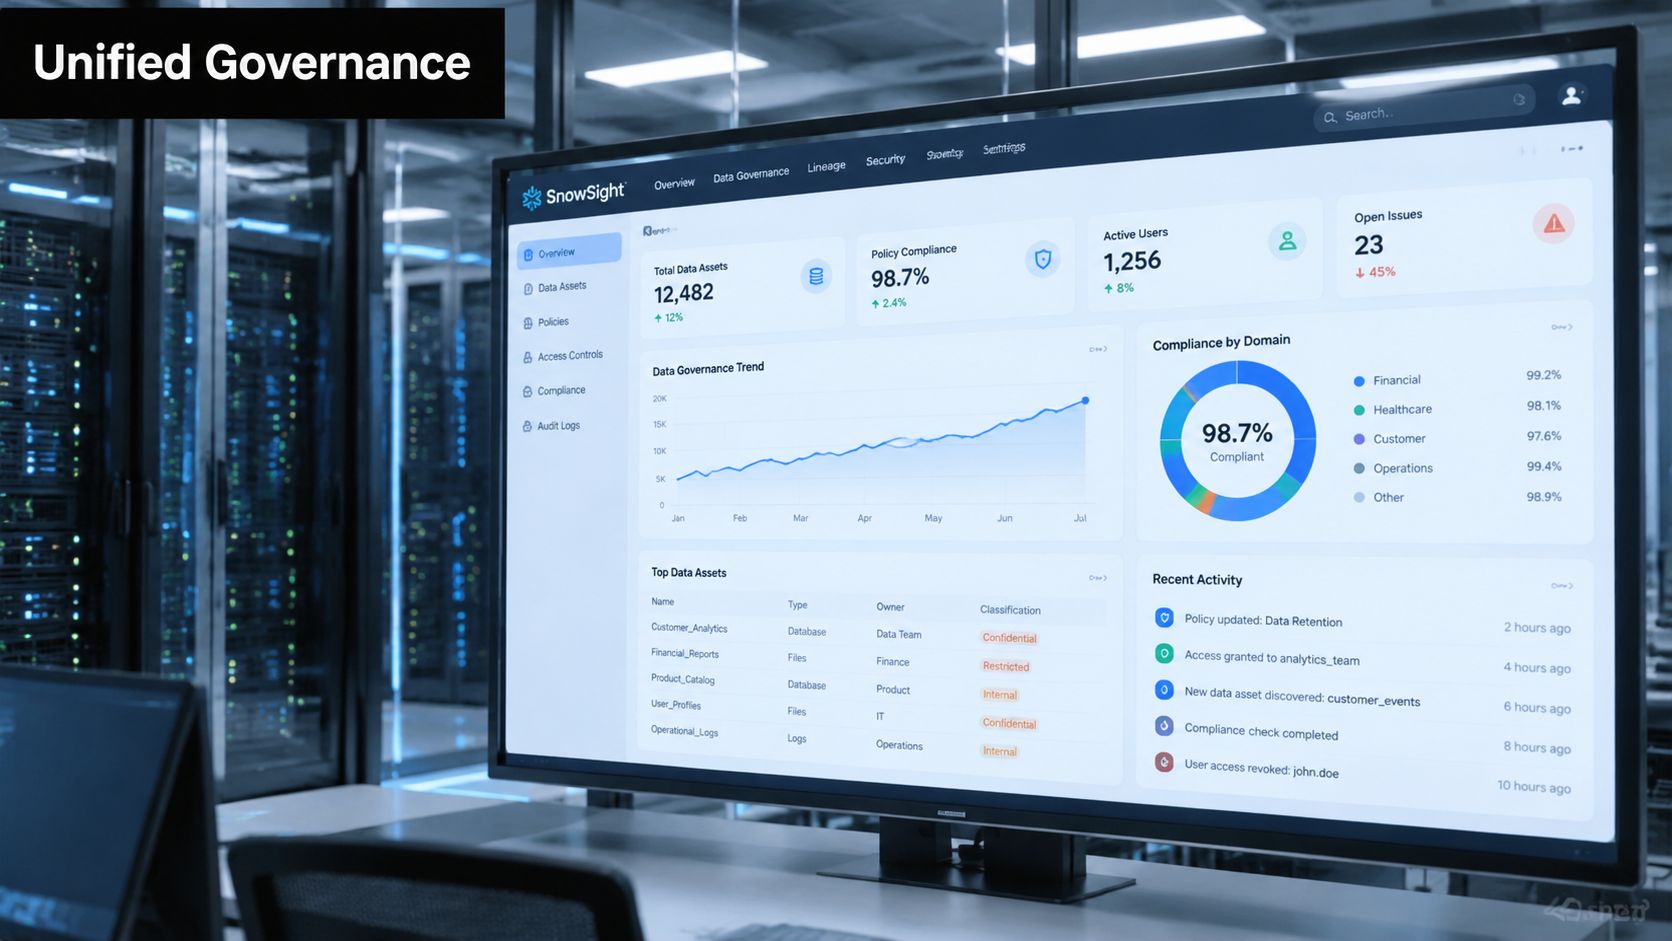
Treat coverage as a governance measure
Coverage doesn't mean that a table is trustworthy. It means that at least one active DMF association exists. Leadership reporting should therefore show coverage alongside incidents, ownership, and criticality. A broad set of low-value checks can create a better coverage number while leaving revenue, patient, or settlement assets weakly governed.
Export monitoring results through the documented result surfaces and build a reporting layer that groups tables by domain, owner, and business criticality. A partner such as Faberwork's Snowflake consulting team can be one option for organizations that need help connecting platform controls with broader delivery and governance practices.
Use AI suggestions as an onboarding aid
Snowflake added AI-suggested data quality checks in Snowsight in February 2026. The preview can inspect a table's recent history and propose checks covering areas such as nulls, uniqueness, and distributions. A human can accept, edit, or decline each suggestion.
That feature is useful for legacy schemas where nobody has documented the original quality assumptions. It isn't a substitute for domain rules. A suggested uniqueness check may be inappropriate for a naturally repeating field, while a distribution check may not capture a healthcare consent requirement or a financial reconciliation tolerance.
Control access and notification flow
Access design needs to be deliberate. Roles may require DATA_METRIC_FUNCTION and USAGE_VIEWER privileges, depending on whether they create, manage, or inspect quality objects. Establish naming conventions for custom DMFs across databases so teams can identify ownership and purpose without opening each definition.
For response workflows, Snowflake alerts can feed notifications, while a Snowpark notifier can route violations to Slack or PagerDuty. Keep the routing tied to severity and ownership. A centralized dashboard tells you what happened, but it doesn't automatically decide who should fix it.
A Walkthrough of a Working Quality Pipeline
A useful production design starts with one business-critical table and follows the signal all the way to remediation. Consider an ORDERS table where ORDER_TS must remain fresh and a customer identifier must be complete.
The first association attaches Snowflake's freshness system DMF to the timestamp column:
ALTER TABLE ANALYTICS.ORDERS

SET DATA_METRIC_FUNCTION = SNOWFLAKE.CORE.FRESHNESS

ON (ORDER_TS);
The exact association syntax and privileges should be validated against the Snowflake account configuration before deployment. The important design choice is that freshness measures the table's operational timeliness, while a separate custom completeness DMF measures the business field that downstream users require.
A stream captures arriving order changes:
CREATE OR REPLACE STREAM ANALYTICS.ORDERS_STREAM

ON TABLE ANALYTICS.ORDERS;
A Snowpark procedure can evaluate the changed window and write failures to a quality table:
def evaluate_orders(session):

    changed = session.sql("""

        SELECT *

        FROM ANALYTICS.ORDERS_STREAM

        WHERE METADATA$ACTION = 'INSERT'

    """)


    violations = changed.filter("CUSTOMER_ID IS NULL") \

        .select_expr(

            "'ANALYTICS.ORDERS' AS OBJECT_NAME",

            "'CUSTOMER_ID_COMPLETENESS' AS CHECK_NAME",

            "COUNT(*) AS METRIC_VALUE"

        )


    violations.write.mode("append").save_as_table("QUALITY.METRIC_VALUES")

    return "completed"
A task calls the procedure when the stream has data. Use a warehouse that can complete the scan and procedure within the ingestion window, then review runtime and queueing before increasing frequency or scope.
ComponentObjectCadenceOutputFreshness measurementFRESHNESS DMF on ORDERS.ORDER_TSScheduled according to the order pipelineDMF resultChange captureORDERS_STREAMConsumed when new rows arriveChanged order recordsCustom completenessSnowpark procedureWhen the stream offset advancesNull-related violation rowsMonitoring surfaceSnowflake result view or table functionQueried by Snowsight or reporting jobsMetric history and statusEscalationSnowflake alert or notifierWhen the expectation is violatedTeam notification
Snowflake makes DMF results available through its event table, results view, and results table function, so the monitoring layer can query both freshness and completeness outcomes. An alert can then notify the on-call channel when the null-count expectation crosses its defined threshold.
For teams working with time-series workloads, this Snowflake time-series data success story provides relevant context for the kinds of operational data patterns that often require freshness and volume controls.
The failure paths need equal attention. If the task is suspended, the stream can accumulate unprocessed changes while the dashboard continues showing the last known result. If the stream falls behind or the procedure stops advancing its watermark, monitoring may appear quiet rather than healthy. Alert on task state, stream lag indicators, and the age of the last successful quality result, not only on failed expectations.
Common Failure Modes and Your First 90 Days
Large Snowflake estates usually struggle with operating discipline, not with writing a null check. Teams monitor a few star tables while satellite schemas remain untouched. Custom DMFs may treat a NULL input as an acceptable outcome instead of a failed evaluation. Alerts without severity tiers train engineers to ignore every notification.
Another problem appears when dbt tests and DMFs evolve separately. Both systems may validate the same rule, but neither is designated as the authoritative control. Coverage reporting then becomes confusing, and incident counts can represent duplicate signals rather than distinct failures.
A focused rollout keeps the first ninety days practical:
- Days 1 to 30, establish the baseline: Instrument the top five revenue-critical tables with built-in DMFs, define ownership, and connect results to the Snowsight monitoring dashboard. Validate that schedules run after ingestion, not before it.
- Days 31 to 60, add domain controls: Create custom DMFs for rules such as HIPAA PHI handling or settlement tolerance checks. Enable AI-suggested checks on one schema, then have domain owners review every recommendation before activation.
- Days 61 to 90, consolidate the operating view: Map dbt tests and Great Expectations suites to a single coverage model, apply ownership tags, retire duplicate controls, and hold a monthly quality review.
The metric that matters most is the percentage of tables with active, owned checks, not the raw number of violations. A rising violation count can mean quality is worsening, or it can mean visibility improved. Coverage with ownership tells you whether the organization has built a control system.
Snowflake's profiling, DMFs, expectations, and centralized monitoring can turn quality from scattered scripts into an operating practice. Start with the assets where an incorrect number changes a decision, document the expected condition, and make one team accountable for the response.
If your Snowflake estate has fragmented checks, unclear ownership, or limited account-wide visibility, assess your critical tables and quality coverage with Faberwork. The team can help design Snowflake-centered data engineering, governance, automation, and monitoring workflows that connect technical controls to the business outcomes your data products support.


