
Snowflake performance and cost depend less on magic settings than on consistent architectural habits. Snowflake's SQL engine reported average query-duration improvements of 10% to 20% in 2026, with best observed gains exceeding 300x in some cases, but the durable lesson is simpler: reduce scanned data, right-size warehouses, and connect workloads to business outcomes.
That's counterintuitive for teams that expect a single warehouse setting or clustering change to solve every problem. In enterprise environments, results usually come from a chain of decisions across SQL design, storage layout, queue management, telemetry, governance, and cost ownership. The most useful Snowflake best practices aren't isolated tricks. They're operating habits that keep each workload fast enough, affordable enough, and safe enough to support the business.
The Foundation of Snowflake Performance
Snowflake succeeds when teams manage three constraints together: how much data a query scans, how long it waits for compute, and how efficiently that compute uses memory. A query can be logically correct and still perform poorly because it scans unnecessary columns, misses micropartition pruning, queues behind other work, or spills intermediate results to storage.
Snowflake's performance guidance emphasizes high data quality, sound data models, careful data-type selection, selective predicates, and selecting only the columns a query needs. Those choices reduce the amount of work Snowflake must perform before the result reaches a user or downstream job. Using bind variables instead of embedding literals can also support more consistent query behavior in applications.
Practical rule: Start by reducing the work the platform must do. Scale compute only after you know the remaining work needs more compute.
Warehouse cache also matters. Repeated workloads can benefit when relevant data remains available in cache, while unpredictable or constantly changing workloads may rely more heavily on efficient scans and appropriate warehouse capacity. Queue time deserves equal attention. A warehouse that handles one query quickly can still create poor user experience when many dashboards, ELT jobs, and ad hoc requests arrive together.
Why habits outperform isolated tuning
A model that stores data in usable types, queries only required fields, and applies selective filters gives every warehouse size a better starting point. By contrast, adding compute to compensate for broad SELECT * queries or poorly selective predicates often increases spend without addressing the underlying scan pattern.
The same reasoning applies to data quality. Duplicated records, inconsistent keys, and unstable transformations create extra joins, retries, and validation work. Engineers then spend time tuning symptoms rather than removing the source of the workload.
Snowflake's broader performance framework has moved from manual inspection toward continuous optimization, including tools such as Performance Explorer, Query Profile, and Snowflake Optima. Snowflake previously reported that average query duration for stable workloads had improved by 40% since the launch of SPI in August 2022, including a 20% improvement in the preceding 12 months. Those figures support a practical conclusion: disciplined observation and automatic optimization can produce meaningful results, but teams still need clean SQL, useful models, and sensible workload design. See this Snowflake partner perspective on collaboration when an internal team needs help connecting platform engineering with delivery requirements.
Enterprise teams should judge a change against a target outcome, not against the excitement of a new setting. Faster dashboard response, fewer queued jobs, predictable batch completion, or lower cost per business process are stronger measures than warehouse size alone.
Right-Sizing Your Compute Warehouses
Warehouse sizing should begin with the smallest warehouse that can plausibly meet the workload's latency requirement. Snowflake's guidance is explicit: scale up when queries spill or don't finish quickly enough, then verify the outcome with telemetry rather than assuming that more compute solved the problem.

A practical sizing sequence
Start by identifying representative queries in QUERY_HISTORY. Don't select only the slowest outlier. Include the recurring dashboard query, the ELT transformation, and the scheduled workload that matters to the business. Record duration, queue behavior, bytes scanned, and signs of memory pressure where available.
Next, compare warehouse consumption in WAREHOUSE_METERING_HISTORY. The objective isn't to prove that a larger warehouse is faster in the abstract. It's to test whether the target workload improves enough to justify the additional compute.
Snowflake recommends checking whether doubling compute roughly halves query time. If it doesn't, a smaller size may be the better resource choice. That result often points to a different bottleneck, such as excessive scanning, poor pruning, an expensive join, concurrency pressure, or a query that spills for reasons compute alone won't fix. The Snowflake performance guidance for well-architected workloads provides the relevant validation approach.
ScenarioActionValidation MetricQueries spill or fail to finish within the required windowTest the next warehouse sizeQuery duration, spill indicators, and completion reliabilityQueries run slowly but compute scaling produces little changeInspect SQL, joins, pruning, and data movementDuration change after scaling, bytes scanned, and profile bottlenecksQueries finish comfortably within the target windowTest a smaller warehouseLatency stability and workload completionInteractive users queue behind scheduled jobsSeparate workloads or evaluate multi-cluster scalingQueue time and user-facing response timeDemand rises unpredictably across concurrent workloadsConfigure multi-cluster behavior where appropriateQueue reduction and cluster utilization
Separate latency from concurrency
A larger warehouse can help an individual query, but it doesn't automatically solve contention between unrelated workloads. Interactive analytics, ELT, data science, and AI-related jobs often have different latency and concurrency profiles. Giving them clear workload boundaries makes telemetry easier to interpret and prevents one workload from hiding another's cost.
Snowflake supports multi-cluster scaling when load increases, with MIN_CLUSTER_COUNT and MAX_CLUSTER_COUNT controlling automatic expansion. That feature addresses concurrency pressure, not inefficient SQL. If users wait because each query scans too much data, adding clusters treats the queue while leaving the work unchanged.
Run a controlled comparison, document the target metric, and keep the smallest configuration that satisfies it. Revisit the decision when schemas, concurrency, or workload schedules change. Right-sizing is an operating practice, not a one-time migration task.
Storage Design and Micro-Partitioning
Snowflake automatically divides tables into micro-partitions. Each micro-partition contains between 50 MB and 500 MB of uncompressed data according to Snowflake's documentation on micro-partitions and clustering. Snowflake stores metadata about these partitions and can avoid scanning partitions that cannot contain rows matching a filter.
That default is powerful enough for many tables. It also creates a common engineering mistake: adding clustering keys before proving that automatic micro-partitioning fails to serve the actual workload.
Default first, clustering second
Automatic micro-partitioning is usually the right starting point for a newly created table. Let the workload develop, then inspect whether repeated filters, joins, or aggregations scan a material portion of the table. Clustering becomes more valuable for larger datasets when the same dimensions repeatedly determine which rows users need.
Consider two contrasting workloads:
- A table queried with varied predicates across many attributes may gain little from a manually selected clustering key.
- A large time-series table repeatedly filtered by device identifier and event time may benefit when those predicates consistently align with the table's access pattern.
A clustering key is a subset of columns or expressions designated to co-locate related data in the same micro-partitions. Snowflake lets teams define one when creating a table or later with ALTER TABLE ... CLUSTER BY, as described in the clustering key documentation.
Clustering is an access-pattern decision, not a decoration on the table definition.
Test the workload, not the theory
Choose candidate keys from real workload predicates. Evaluate cardinality, filter selectivity, join behavior, and the proportion of query duration spent scanning. Test the candidate on a representative subset before applying it broadly. That step exposes whether maintenance complexity and compute cost are justified by better pruning.
Clustering can also become counterproductive when teams select too many columns, choose columns users rarely filter, or assume that every large table needs manual organization. A key that doesn't match the workload adds operational overhead without solving the query's bottleneck.
Search optimization is a different tool. Snowflake positions it for highly selective access patterns and fast dashboard response, and its documentation says at least one filtered column should have on the order of 100,000 distinct values or more for a query to benefit, as explained in the Search Optimization Service guide. Use it for targeted lookup-style queries rather than as a replacement for sound table design.
For time-series workloads, a focused implementation example can help teams compare ingestion patterns and query requirements, such as this Snowflake time-series data success story. The decision remains workload-specific: measure scan behavior first, then pay for organization where it changes the outcome.
Cost Optimization Beyond Warehouse Sizing
Warehouse size is visible. Workload-level value is not. Many enterprises can see account consumption and set resource monitors, yet still can't answer which product, team, pipeline, or AI process is responsible for credits and what business result those credits support.
Snowflake's cost-management framework groups the problem into visibility, control, and optimization. That framing is more useful than treating cost as a monthly alarm. Visibility tells you what ran. Control sets boundaries and ownership. Optimization changes the workload or architecture after you understand the value it produces. Snowflake's cost guidance also highlights per-second billing optimization, which makes workload behavior and start-stop patterns more relevant to spend management.
Allocate consumption to outcomes
Start by defining a unit economic measure for each important workload. Snowflake's quickstart examples include cost per terabyte analyzed and cost per fraud case prevented, both of which connect technical consumption to an operational result. The measure doesn't need to be perfect on the first iteration. It needs to be consistent enough for teams to compare changes.
A practical allocation model can combine warehouse ownership, query tags, database and schema boundaries, service identities, and scheduled job metadata. The design should answer four questions:
- Who owns the workload? Assign a team or product owner.
- What does it produce? Identify the report, model, decision, or customer-facing capability.
- What does it consume? Track credits, execution time, scanned data, and concurrency.
- What outcome matters? Select a business unit such as a processed case, analyzed terabyte, completed forecast, or served customer request.
A broader application of cloud cost optimization practices can complement Snowflake-specific telemetry. The useful connection is not a generic dashboard. It's a shared operating model that lets finance, engineering, and product teams discuss the same workload in terms of both consumption and value.
Move from alerts to decisions
A resource monitor can tell you that usage crossed a threshold. It can't tell you whether a costly fraud model prevented losses, whether an executive dashboard justifies its refresh frequency, or whether an ELT job is processing redundant data. Those questions require ownership metadata and business context.
Use the allocation view to make targeted decisions. Reduce unnecessary refreshes, consolidate duplicate transformations, separate experimental workloads, or redesign a pipeline that scans data repeatedly. Keep a workload when its unit economics are favorable, even if its raw credit use is significant. Challenge a cheap workload when it produces little usable value.
Per-second billing rewards precise operational scheduling, but only when teams know which jobs start, stop, overlap, and retry. Cost optimization becomes durable when each workload has a named owner, a target outcome, a baseline, and a review rhythm.
Secure Data Sharing Across Environments
Data sharing becomes difficult when a clean local security model meets an external consumer, another cloud, a separate region, or a collaborative analytics environment. The risk isn't limited to unauthorized access. Teams can also lose policy consistency, approval history, and accountability when they create unmanaged extracts to work around sharing constraints.
Snowflake shared objects are read-only, and filtered sharing requires secure views, according to the Snowflake data sharing documentation. Cross-region sharing can require replication groups and additional handling when views span multiple databases. Those mechanics matter because a sharing design must preserve the same policy intent after data leaves the original administrative boundary.
Treat every sharing path as a control point
A secure architecture begins with the object being shared. Share a purpose-built secure view rather than exposing a broad base table. Apply masking and row-level policies before the share is approved, and verify how those policies behave for the recipient's role and access context.
Approval workflows should record the business purpose, permitted fields, recipient, region or cloud scope, retention expectations, and owner responsible for review. A partner ecosystem needs repeatable controls. Manual exceptions may solve one urgent request, but they create uncertainty when the same data is shared again through another path.
Use a small set of patterns:
- Governed partner views expose only the columns and rows required for a defined collaboration.
- Cross-region replication supports approved sharing where location requirements demand additional replication configuration.
- Clean-room style collaboration keeps sensitive inputs governed while allowing approved analysis without unmanaged raw exports.
- Internal data products provide reusable, policy-aware interfaces for teams that would otherwise copy data into separate environments.
Preserve policy behavior, not just object names
A view can be secure in its source environment and still create a governance gap if downstream teams don't understand its masking, filtering, or approval assumptions. Document policy dependencies with the shared object. Test representative roles, including a user who should see a masked value and one who should not see the row at all.
Cross-cloud design also needs operational ownership. Someone must monitor share recipients, review access, handle policy changes, and retire stale collaborations. Security teams should receive evidence of what was shared and why, while data teams need a delivery pattern that doesn't force them back to uncontrolled files.
The strongest approach is secure by default, useful by design. Expose the minimum data needed for the agreed use case, automate approvals where policy allows, and treat every new region, cloud, partner, and collaboration workflow as a separate control decision. That balance protects regulated data without turning legitimate analysis into an extraction exercise.
Operational Monitoring and Continuous Optimization
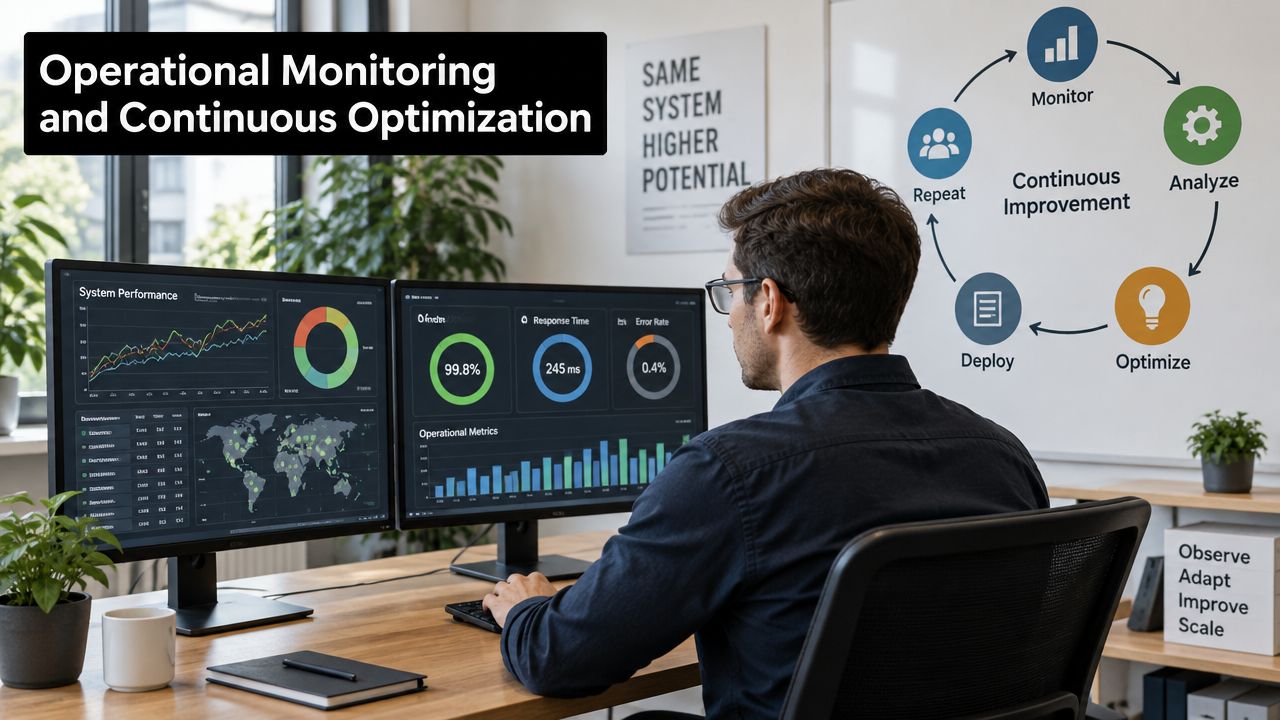
Performance work fails when teams tune once and then stop looking. Data volumes change, dashboards multiply, transformation logic evolves, and concurrency shifts. A warehouse that met its latency target during migration may later develop queueing, spills, or rising scan costs without any single dramatic failure.
Snowflake's optimization history includes Performance Explorer, Query Profile analysis, and Snowflake Optima, which continuously analyzes workload patterns and applies strategies automatically. These services don't remove the need for engineering judgment. They give engineers better evidence for deciding whether a problem belongs in SQL, storage, modeling, or compute operations.
A monitoring rhythm that works
Use a simple operating checklist:
- Review query history: Find recurring slow queries, rising queue time, failed statements, and workloads whose duration has drifted.
- Open Query Profile: Identify large scans, expensive joins, repartitioning, and memory spillage before changing warehouse size.
- Compare warehouse metering: Relate compute consumption to the workload and confirm whether a configuration change improved the target metric.
- Check storage behavior: Look for repeated filters that justify clustering or highly selective lookups that may justify search optimization.
- Inspect concurrency: Separate user-facing latency from batch completion and determine whether multi-cluster scaling addresses the actual constraint.
- Record the decision: Capture the baseline, change, expected outcome, and follow-up result.
The purpose of the checklist is not more reporting. It's faster diagnosis. Query Profile can show that a query spends its time scanning rather than computing, while warehouse telemetry can show that a larger warehouse changed little. Those observations prevent expensive changes that leave the bottleneck untouched.
Operational advice: Every optimization should have a measurable target and a rollback path.
Keep automatic optimization accountable
Snowflake Optima can apply strategies based on workload patterns, but teams still need to watch for changes in cost, latency, and behavior. Automatic improvements should be evaluated against service objectives and workload economics, not accepted because they sound technically advanced.
For high-value workloads, create a review cadence around the business process. A customer-facing dashboard may need response monitoring. A nightly ELT pipeline needs completion reliability. An AI workload may need cost per useful output. Query history and warehouse metering provide the technical evidence, while product owners define whether the outcome is good enough.
Faberwork LLC is one option for organizations that need Snowflake-centered data architecture, query optimization, or managed engineering support alongside internal teams. The important requirement is the operating model, whether monitoring is handled internally, by a partner, or through a hybrid team. Someone must own the telemetry, interpret the bottleneck, and verify that the change improved the result.
Snowflake's performance guidance is consistent across tools and workloads: reduce scanned data, reduce queueing, avoid memory spillage, use cache where it helps, and keep compute aligned with the smallest warehouse that meets the latency goal. The enterprise advantage comes from applying those principles continuously and connecting them to cost and governance decisions.
If your Snowflake environment has rising warehouse spend, unpredictable query latency, or sharing workflows that depend on manual exceptions, audit it by workload rather than by account total. Map owners, outcomes, query patterns, storage behavior, and sharing controls, then use the resulting evidence to prioritize the changes that improve performance, cost accountability, and secure collaboration.


