
A port closes without warning. The dispatch lead sees the closure event, checks container locations, predicts which routes will miss their service windows, and reroutes vehicles before the next customer call arrives. The team doesn't wait for tomorrow's report because the decision loses value with every minute of delay.
That is the practical promise of operational intelligence. It connects current operational data to a decision and then, where appropriate, to an action. The difference isn't another attractive dashboard. The difference is whether the business can respond while the event still matters.
A Practical Definition of Operational Intelligence
Operational intelligence is the discipline of turning fresh, often streaming data into a next-best action. The action might be automatic, recommended to a supervisor, or recorded for later review. The defining point is that the system supports a decision inside the same working minute, rather than summarizing an event after the operating window has passed.
Consider an operating room. A dashboard that reports yesterday's procedure results helps administrators review performance. An observability monitor shows a patient's current vital signs. Operational intelligence is closer to the clinician or coordinator deciding what needs to happen next, based on live signals, known constraints, and an available intervention.
A useful analogy separates the disciplines:
- Business intelligence is the post-game film review. It helps leaders understand what happened and why.
- Observability is the doctor's vitals monitor. It shows whether a system is behaving normally right now.
- Operational intelligence is the coach on the sideline. It interprets the situation and calls the next play.
The discipline has roots well beyond modern analytics software. A U.S. Army historical paper on operational intelligence traces the idea through military intelligence organizations, signals intelligence, the Pearl Harbor intelligence failure, and the National Security Act. The historical thread is consistent: organizations needed to collect, process, and distribute information quickly enough for it to affect operations.
The three ingredients
An OI system needs three connected ingredients.
- Continuous data ingestion brings in events from systems such as fleet telematics, factory equipment, point-of-sale terminals, or network infrastructure.
- A decision model evaluates the current state against business goals, constraints, confidence rules, and likely outcomes.
- An action surface lets the system execute or route the decision through an API, workflow, ticket, message, or agent. That surface should close the loop without forcing an operator to re-key information.
For example, a fleet system might receive a road closure, compare it with vehicle positions and delivery commitments, calculate alternatives, and send a reroute to the driver's application. A human may still approve the change, but the system has prepared the decision from current data.
Teams working with smaller field operations can also explore practical AI tools for Australian trades when evaluating how automation can reduce manual coordination. The same principle applies at enterprise scale: connect a live signal to a controlled intervention and measure the result.
Operational Intelligence vs BI and Observability
The fastest way to understand operational intelligence is to compare the question each discipline answers. BI asks what happened. Observability asks what is happening inside a technical or operational system. OI asks what should happen next and provides a path to make it happen.
DimensionBusiness IntelligenceObservabilityOperational IntelligenceCore questionWhat happened?What is happening now?What should happen next?Typical freshnessDaily or periodic batchesNear-current system signalsFresh event and process dataPrimary userExecutive, analyst, or managerSRE, engineer, or platform teamOperator, dispatcher, supervisor, or agentMain outputDashboard, report, or trendAlert, trace, log view, or diagnosticRecommendation, workflow, or triggered actionFailure preventedRepeating poor decisions because results weren't measuredProlonged technical incidentsDelayed intervention while an operational condition changes
The table describes the center of gravity, not rigid product boundaries. A modern data platform can support all three. An observability platform can expose events that an OI system consumes. BI can later measure whether the intervention improved service, cost, throughput, or reliability.
The overlap matters
Suppose a distribution center experiences a sudden backlog. Observability might show that a scanning service is timing out. OI combines that signal with dock activity, staffing, order priority, and carrier schedules. It can recommend moving work to another lane or open a controlled workflow for a supervisor.
BI then answers a different question. Did the intervention reduce backlog? Did it protect delivery commitments? Did the extra labor cost more than the avoided disruption? Without that measurement, the action layer can become busywork that looks responsive but doesn't create value.
Practical rule: Choose the discipline based on the decision you need to make, not the name of the product you already own.
A BI report won't help much when a vehicle must be rerouted immediately. An observability alert won't tell a logistics manager which customer commitments to protect. An OI workflow shouldn't replace historical analysis when the question concerns planning, budgeting, or long-term performance.
The right enterprise stack uses these layers together. Observability supplies technical and process signals. Operational intelligence interprets those signals in context and coordinates action. BI evaluates the accumulated outcomes and helps leaders improve the rules.
How the Architecture and Data Flows Actually Work
A practical OI pipeline starts where events occur. Point-of-sale terminals emit transactions, fleet telematics sends location and vehicle state, building sensors report equipment conditions, and CDN logs capture application behavior. A streaming layer such as Kafka or Kinesis can move those events into the data platform quickly instead of waiting for a scheduled file load.

Snowflake can ingest streaming data through Snowpipe Streaming and can use tasks to coordinate transformations and downstream processing. The design should separate data by purpose:
- Raw landing data preserves the incoming event and its source context.
- Conformed data applies shared identifiers, timestamps, units, and business definitions.
- Serving data presents the current state and derived features to dashboards, rules, workflows, and agents.
That separation protects traceability while keeping decision queries focused. A Snowflake architect designing time-series workloads can also review this Snowflake time-series data success story for a concrete reference point.
Build a freshness budget
Every stage consumes time. The source may take time to emit an event. The stream may buffer it. Ingestion, transformation, feature calculation, scoring, approval, and execution each add delay. The team should assign a freshness budget to the decision, then test each stage against that budget.
Materialized views and dynamic tables can carry prepared data toward the serving layer, while rules and machine-learning outputs evaluate the current state. A logistics feature model could combine current location, route status, estimated arrival, and customer priority. A decision rule might then determine whether to recommend a reroute, request approval, or take no action.
The technical research points toward the same architectural choice. A study of industrial-operational analytics reports a mean latency effectiveness score of 4.08 for hybrid multi-layer designs versus 3.41 for single-layer designs, and describes event-driven or change-data-capture approaches as fresher than batch refreshes (industrial-operational analytics research). The practical implication is straightforward: stale data weakens the decision loop.
The final stage is the action surface. APIs can update a transport-management system. Workflow engines can assign a task. An Agentic AI agent can inspect permitted tools, call a Snowflake query or operational API, request approval, and write the outcome back to the event ledger.
If the full path takes too long, the platform may still be useful for monitoring, but it isn't delivering operational intelligence for that decision. The exact threshold depends on the process. The team should define it before choosing infrastructure, then measure signal-to-action time in production.
Where Agentic AI Changes the Loop
A conventional alert stops at notification. An Agentic AI system can observe a signal, reason over relevant context, plan a response, call approved tools, and record what happened. That changes OI from a passive monitoring layer into a controlled operational executor.
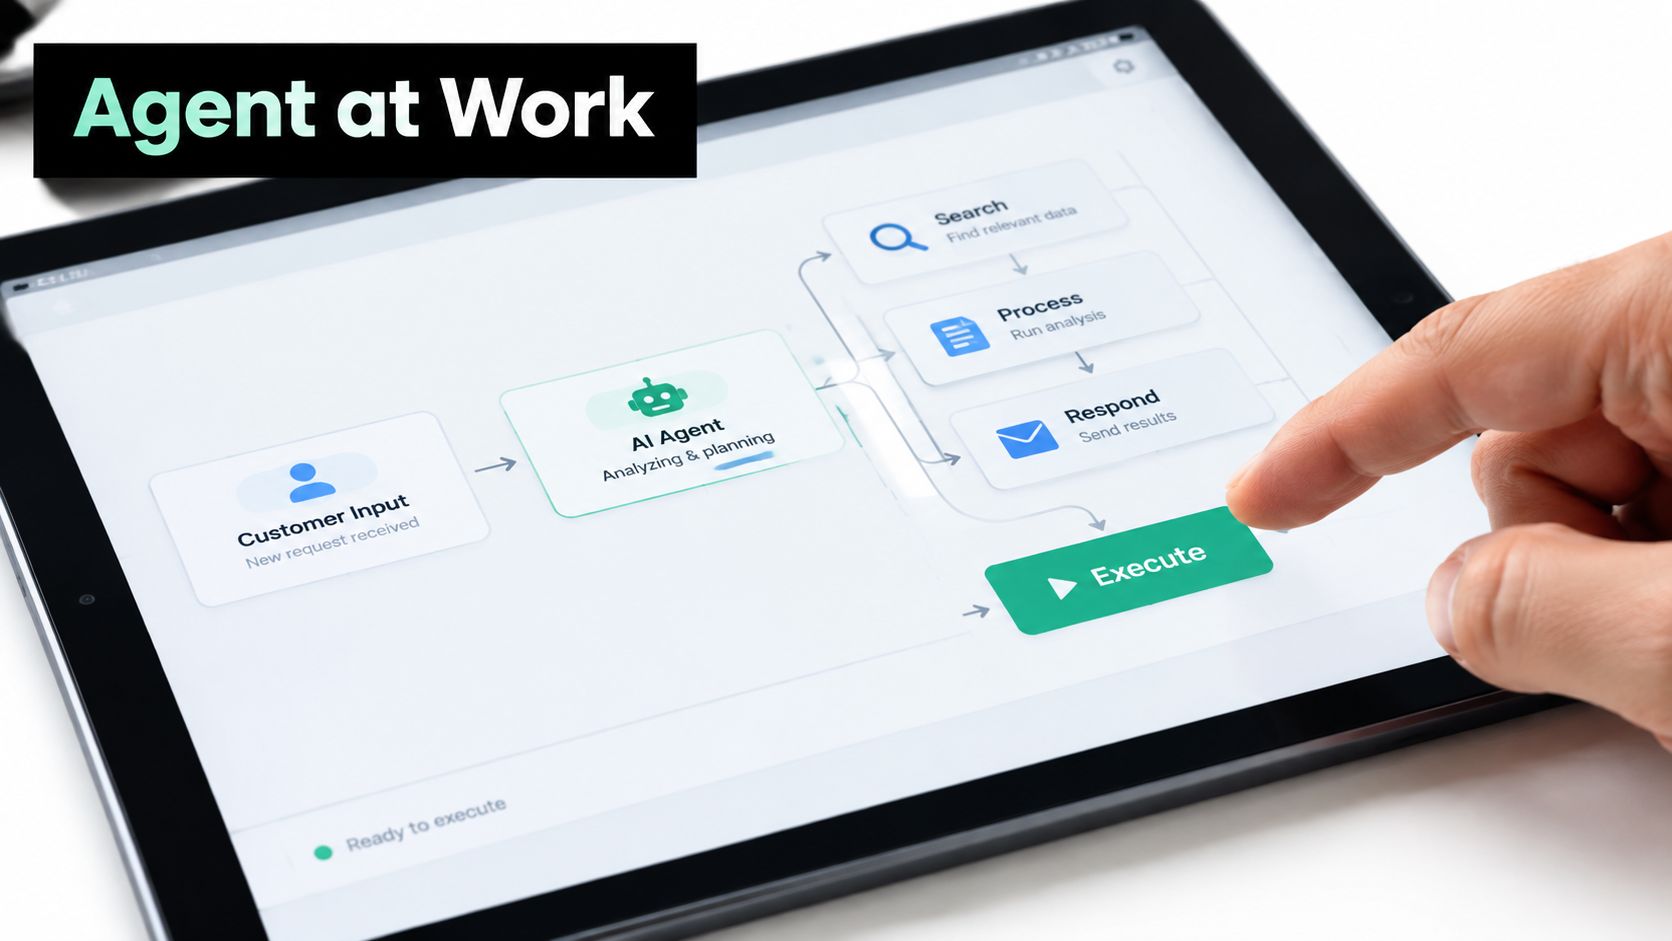
The agent needs three capability layers.
Perception identifies fresh events and assembles the current state. A shipment delay, a sudden capacity drop, or an HVAC fault becomes meaningful only when the agent can connect it with location, ownership, service commitments, and recent history.
Reasoning evaluates choices. It can compare routes, identify a likely cause, estimate constraint conflicts, and produce a plan. The agent should use structured features, deterministic rules, and governed data rather than rely on a language model to infer facts from an unfiltered event stream.
Governed action determines what the agent may do. It might reroute a shipment within defined boundaries, open a maintenance ticket, adjust a permitted network setting, or ask a human to approve a higher-impact intervention.
The shared Snowflake state is important because an agent needs current, consistent, traceable context. Without common data definitions and lineage, the agent can act on an outdated status, duplicate an intervention, or confuse one asset with another. With a governed data layer, the organization can inspect the input, decision, tool call, and result after the event.
Human work changes rather than disappears. Operators define objectives, approve sensitive actions, review escalations, and tune decision policies. They shouldn't spend their time copying alert details into another system or running the same diagnostic query after every predictable event.
A useful implementation test is simple: can the agent explain which current signals supported its plan, identify the tool it intends to call, and record whether that tool succeeded? If the answer is no, the system may automate activity without creating trustworthy operational intelligence.
The following video provides another visual way to think about AI-supported operational workflows.
Real-World Outcomes in Logistics, Telecom, and Smart Buildings
The strongest OI examples start with an operational decision, not a platform feature. Each one has a trigger, a constrained response, and an outcome that the business can inspect.
In logistics, a shipment event has value only when someone can use it to protect the delivery. A streaming system can combine port conditions, container location, carrier schedules, and customer commitments. The decision layer can identify congestion, compare routes, and send a rerouting recommendation to a dispatcher or transportation workflow.
A logistics streaming-analytics deployment moved visibility from four to six hour delays to sub-second tracking across more than 50,000 daily shipments, while reporting 73% fewer customer service escalations, a 28% improvement in on-time delivery, and $23 million in annual savings (logistics streaming analytics case study). Those outcomes show why freshness matters. A report that arrives hours later can explain a missed delivery, but it can't protect the commitment that was still recoverable earlier.
For teams assessing the physical equipment behind logistics workflows, a reliability guide for logistics equipment can add useful maintenance context. Equipment state belongs in the same decision picture as shipment state when a scanner, conveyor, or vehicle can create downstream delay.
Telecom operations present a different pattern. A carrier can combine radio-access telemetry with weather, planned events, and outage information. The OI system can identify a coverage or capacity risk, recommend a rebalancing action, and route the change through a network workflow. A human may approve the change when the impact is broad, while lower-risk adjustments can follow a pre-authorized path.
Smart buildings add a distributed physical layer. HVAC readings, occupancy signals, energy conditions, and tenant-service requests can be evaluated together. An agent can prepare a zone before a demand peak or open a technician dispatch when equipment behavior suggests a problem, rather than waiting for a complaint to become the first signal.
A smart-building implementation using TensorFlow and Snowflake is described in this smart buildings success story. The key design question remains operational: which signal should trigger a control change, and which should only create a recommendation?
IndustryTrigger SignalAgent ActionMeasured OutcomeLogisticsShipment and network eventsTrack, assess, and support reroutingSub-second visibility, 73% fewer escalations, 28% better on-time delivery, and $23 million in annual savings in the cited caseTelecomNetwork telemetry combined with external operating contextRecommend or execute capacity and incident workflowsFaster operational response and better service continuity, with local metrics defined by the carrierSmart buildingsHVAC, occupancy, energy, and service signalsPrepare zones or dispatch maintenanceFaster reporting, less manual reconciliation, and proactive maintenance can be measured against building operating records
Other operational deployments show the value of replacing manual reporting with action-ready visibility. A drilling implementation reported 50% faster operational and executive reporting, 35% less manual data reconciliation, and 15% less downtime through proactive maintenance (drilling operational visibility case study). The same pattern appears across industries: ingest the signal, preserve context, decide with rules and models, then measure the result.
Trust Thresholds and Governance for Action-Grade Insights
The difficult OI question isn't whether a system can detect an event. It's whether the system should act on that event without a person.
A low-risk action with a reversible outcome can often use automatic execution when the data is fresh, the signals agree, and the decision model has a strong operating history. A higher-impact action should create a recommendation for a named owner. An uncertain or poorly understood signal should be logged and held rather than converted into an automated intervention.
Set the action policy before the model
Confidence shouldn't be a single number disconnected from context. Teams should consider data freshness, agreement between independent signals, historical error patterns, action reversibility, and the potential cost of a false positive or false negative.
Snowflake can support governance through role-based access, row policies, and query history. Those controls help teams limit what a user or agent can see and do, while preserving an audit trail for investigation. Agentic AI guardrails should apply the same discipline to tools. An agent permitted to create a maintenance ticket shouldn't automatically receive permission to change a production network configuration.
Governance test: Every automated action needs an owner, a reason, a permitted scope, and a rollback path.
Use this short checklist before enabling the first action:
- Choose the action class: Decide whether the outcome is automatic, approval-based, or log-only.
- Set the minimum confidence: Account for freshness, signal agreement, and the cost of an incorrect intervention.
- Define the escalation owner: Name the person or team responsible when the agent can't meet the threshold.
- Capture rollback behavior: Record how the system reverses or contains the action when execution fails.
This approach keeps governance attached to the decision rather than bolted onto a dashboard after deployment. It also gives risk teams something concrete to review: inputs, permissions, thresholds, actions, and outcomes.
A Short Rollout Playbook and What to Measure First
Start with one decision that creates friction and has a clear owner. Don't begin with an enterprise-wide promise to automate operations. Choose a process where people already wait for signals, copy data between systems, or repeat the same response.
Four practical phases
- Select the decision. Pick a high-friction event such as shipment rerouting, maintenance dispatch, or capacity protection. Measure the current cycle time from signal to action.
- Connect one streaming source. Bring the event into a Snowflake landing table, preserve its source context, and create the conformed fields needed for the decision.
- Define the action and confidence gate. Specify the tool call, permitted scope, approval path, escalation owner, and rollback method before the agent operates.
- Expand after evidence. Add related signals, additional workflows, or more sites only after the first loop produces reliable operational records.
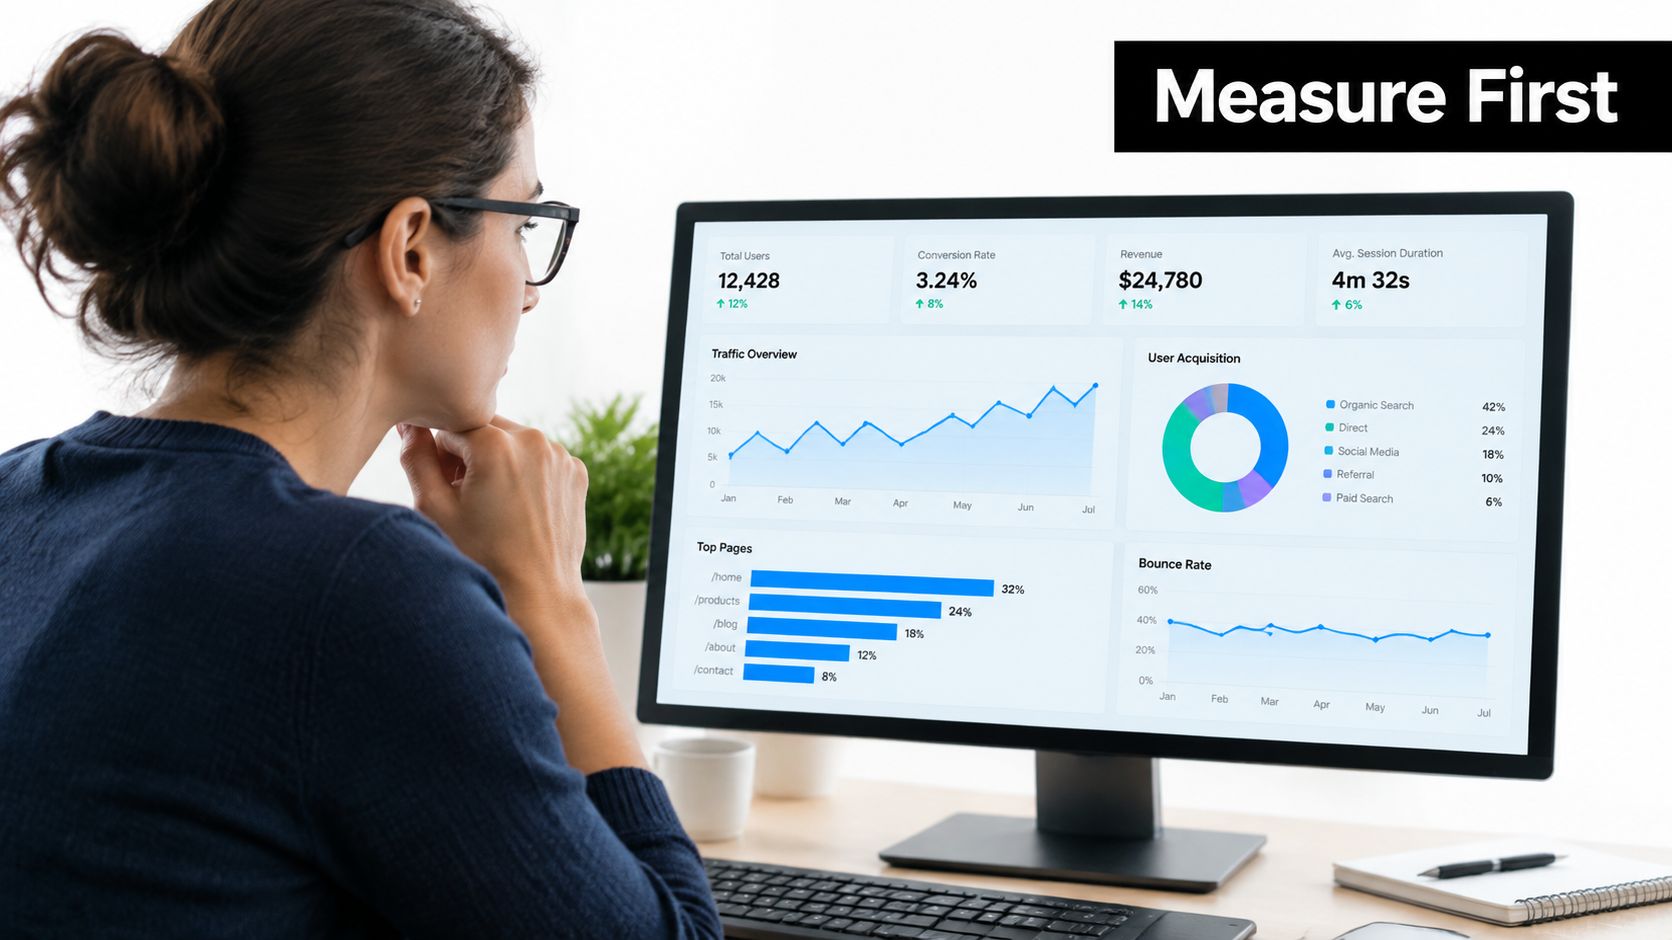
Track one primary metric first: cycle time from signal to action. It exposes delays in ingestion, transformation, decisioning, approval, and execution. A fast model won't help if the event reaches the serving layer late or the workflow leaves an operator re-entering information.
Then add outcome measures that match the chosen decision:
- Time to detect: How quickly the system identifies the condition.
- Time to act: How quickly an approved response reaches the operating system.
- Share of decisions auto-resolved: How often the workflow completes without escalation.
- Avoided cost per incident: The financial effect of preventing or reducing the disruption.
The rollout is working when the architecture delivers fresh context, the governance layer keeps action within scope, and the business can connect each intervention to an outcome. If you're evaluating a Snowflake-centered operational intelligence or Agentic AI workflow, Faberwork's data analytics and automation services can be considered alongside other implementation options.
Start by documenting one high-friction decision, its freshness budget, its trust threshold, and its rollback path. Then connect the smallest reliable event stream and measure signal-to-action time before expanding the system across more operations.


