
In the hyper-competitive world of retail, winning isn't about having the most products on your shelves; it's about making the smartest decisions. This is where business intelligence comes in. It's the engine that turns raw sales figures, customer feedback, and inventory levels into a clear, actionable roadmap for growth.
This is your practical guide to building a retail business that's more resilient, profitable, and in tune with what your customers want.
Why Retail Runs on Data, Not Guesswork
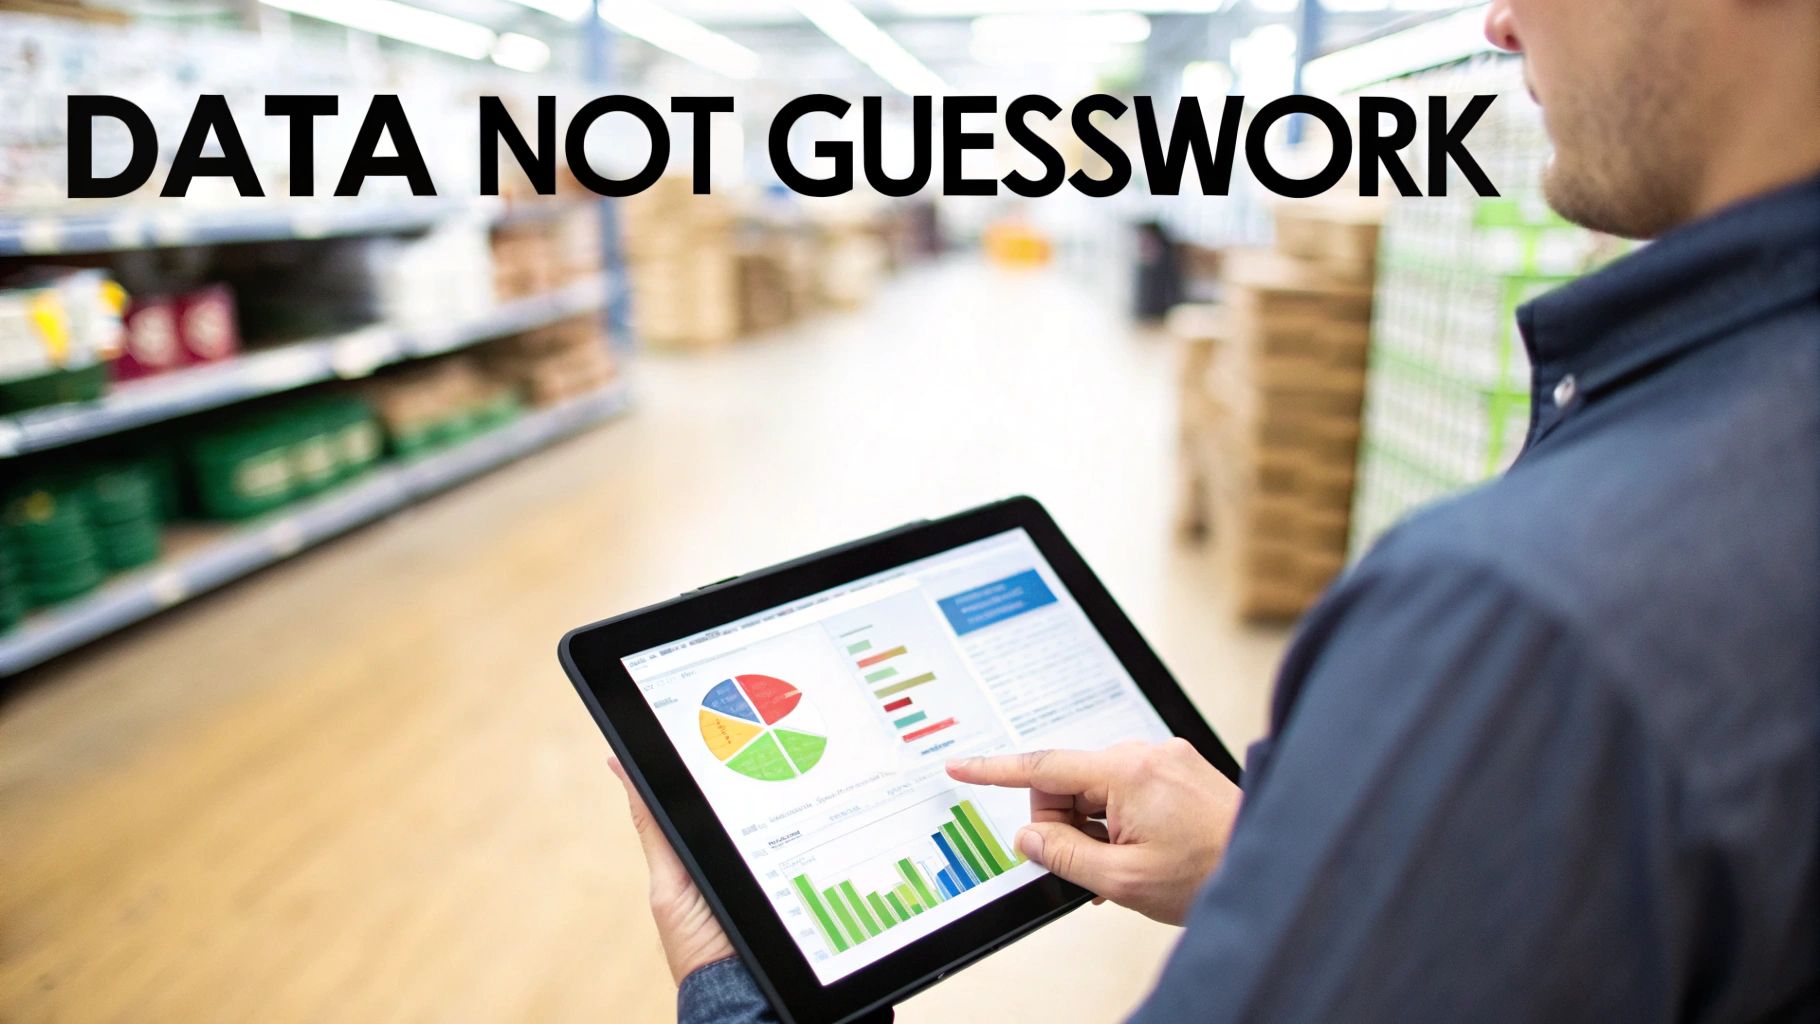
Business Intelligence (BI) is a powerful lens that reveals exactly what customers are buying, which products are selling fastest, and where you can cut costs. It’s the shift from relying on gut feelings to acting on hard facts, moving your entire operation from reactive to proactive.
Data-driven insights are the bedrock of modern retail. By analyzing sales patterns, a store can predict demand for seasonal items with shocking accuracy. The outcome? No more costly overstock sitting in the backroom and no more stockouts that send customers to your competitors. This jump from guesswork to informed strategy separates thriving retailers from those just keeping up.
The Core Value of Retail BI
The goal is simple: achieve better results by understanding your data. Instead of reacting to last month's sales report, you're anticipating next month's trends. Research shows that organizations using BI to personalize the customer experience can generate 5.7 times more revenue than competitors.
This data-first approach delivers clear outcomes across your business:
- Optimized Inventory: Eliminate waste and slash carrying costs by stocking only what you need.
- Enhanced Customer Experience: Build loyalty by offering personalized recommendations and promotions that customers value.
- Improved Operations: Fix inefficiencies in your supply chain and in-store processes to save money.
- Competitive Edge: Spot market trends early and adapt faster than the competition.
Business intelligence isn't a luxury; it's a fundamental requirement for growth in retail. It provides the clarity to make confident, strategic moves that directly impact your bottom line.
Moving Beyond Basic Reports
Traditional reporting tells you what happened. BI tells you why it happened and what will likely happen next.
It connects dots you didn't know existed. You might discover how a local festival tanks sales for one product but sends another through the roof, or which marketing channels deliver your most valuable customers. As you explore the different applications of data across industries, you’ll see a common theme: better data leads to better decisions. This guide shows you how to apply that principle to your retail operations.
How Retail BI Delivers Real Results
Let's move past the theory. A solid BI framework isn't about generating pretty charts; it's about making sharper decisions that directly grow your bottom line. These data-backed wins turn mountains of information into clear, profitable action.

The financial impact is clear. The global retail analytics market is set to explode from $7.56 billion in 2023 to $31.08 billion by 2032. This growth reflects the urgent need for retailers to make sense of their data. North America led the charge in 2023 with a 39.42% market share, as giants like Walmart and Kroger use these tools to refine their operations. You can dig into the market growth projections and insights to see the full picture.
Optimize Inventory and Eliminate Waste
One of the first and most powerful outcomes of retail BI is getting inventory right. For years, retailers have been plagued by two expensive problems: overstocking, which burns capital, and stockouts, which kill sales.
Business intelligence swaps guesswork for predictive analytics. By digging into historical sales and real-time trends, BI tools forecast demand with incredible accuracy. This is the key to ordering the right product, in the right quantity, at exactly the right time.
- Use Case: A fashion retailer's BI system analyzes last winter's sales, spotting that heavy coats sold well up north while mid-weight jackets were winners down south. The next year, they adjust inventory allocation based on this insight, cutting end-of-season markdowns by 30% and preventing stockouts of popular items.
Unlock Dynamic and Profitable Pricing
Pricing is a constant balancing act. Go too high, and you scare customers away; go too low, and you give away profit. Retail BI delivers the data for dynamic pricing, a strategy that maximizes margins without punishing customers.
By crunching data on competitor prices, demand, and even external factors like a local festival, you can adjust prices on the fly. This keeps you competitive while seizing every opportunity to improve margins.
BI transforms pricing from a static decision into a dynamic strategy. You can react to market conditions in hours, not months, capturing value that would otherwise be lost.
Build a True 360-Degree Customer View
Knowing your customer is everything. BI builds a true 360-degree customer view by pulling together data from every touchpoint: in-store purchases, website clicks, loyalty programs, and customer service chats.
This unified profile uncovers buying habits, reveals product affinities, and calculates lifetime value, paving the way for hyper-personalized marketing that works.
- Use Case: An online cosmetics brand uses BI to connect a customer’s purchase history with their browsing behavior. The system flags that she repeatedly views a high-end skincare line but never buys. It triggers a targeted email offering a free sample with her next order. The outcome? A 15% lift in conversion for that product and a customer who feels understood.
Master Demand Forecasting for a Competitive Edge
Great demand forecasting isn't about looking in the rearview mirror; it's about seeing what's coming. It’s the ability to spot market shifts and predict seasonal rushes before they happen. BI makes this possible by sifting through massive datasets to find signals that point to future demand.
This foresight is a huge competitive advantage. It ensures you have the hot new product ready for launch and the supply chain prepared to handle the surge.
- Use Case: A home goods retailer’s BI platform spots a rising search trend for "sustainable home office" products. By layering in social media sentiment, it predicts a spike in demand. The company proactively boosts its stock of eco-friendly desks, launching a targeted campaign two weeks ahead of the competition and capturing the market.
Measuring the Metrics That Actually Matter
Data is everywhere in retail, but turning that information into profitable action is the real game. The trick isn't to track everything; it's to focus on the Key Performance Indicators (KPIs) that act as the vital signs for your business.
A good BI strategy zeros in on the metrics that tell a story about your inventory, pricing, and customers. These are the numbers that guide your next move.
KPIs for Inventory Optimization
Smart inventory management is at the heart of any successful retail operation. Get it right, and cash flow is healthy. Get it wrong, and you're drowning in storage costs. It all comes down to balancing supply and demand.
Two of the most telling metrics are:
- Inventory Turnover: This tells you how many times you sold and replaced your inventory in a given period. A high turnover rate means products are selling fast and capital isn't tied up in a warehouse.
- Sell-Through Rate: This percentage shows how much of a specific product you've sold compared to how much you received. It's perfect for judging the success of a new item, helping you avoid overstocking.
Metrics for Pricing and Profitability
Your pricing strategy instantly hits your bottom line. But just looking at revenue doesn't tell the whole story. You need a metric that ties pricing directly to your investment in stock.
Gross Margin Return on Investment (GMROI) is the one to watch. This powerful KPI tells you how much gross profit you made for every dollar you spent on inventory. If your GMROI is over 1.0, you're efficiently turning your inventory into profit.
GMROI forces you to think about both profit margin and sales speed, bringing that critical relationship into sharp focus.
Gauging Customer Strategy Success
Bringing in new customers is expensive; sustainable growth comes from keeping the ones you have. With BI, you can measure the health of your customer relationships. Our exploration of meaningful metrics further aligns with understanding the top e-commerce metrics and KPIs essential for business success.
Keep an eye on these two forward-looking indicators:
- Customer Lifetime Value (CLV): This forecasts the total profit you can expect from a customer over their entire relationship with you. A rising CLV is a strong signal that your personalization efforts are paying off.
- Churn Rate: This is the percentage of customers who walk away during a specific period. A high churn rate is a red flag that something is wrong with your product, pricing, or customer experience.
Evaluating Demand Forecasting Accuracy
The point of demand forecasting is to get as close to reality as possible. The only way to improve your predictive models is to constantly measure their performance.
Forecast Accuracy measures the gap between what you thought would sell and what actually sold. By tracking this, your team can tweak algorithms and fine-tune future predictions. A tiny improvement in accuracy can translate into millions of dollars saved by preventing stockouts and reducing waste.
Essential Retail BI KPIs and Their Impact
Business AreaKPIWhat It MeasuresBusiness ImpactInventoryInventory TurnoverThe speed at which inventory is sold and replenished.Indicates sales velocity and inventory efficiency, freeing up cash flow.InventorySell-Through RateThe percentage of units sold versus units received.Assesses the performance of specific products or marketing campaigns.PricingGMROIThe gross profit generated for every dollar invested in inventory.Reveals the true profitability of your product mix.CustomerCustomer Lifetime Value (CLV)The total predicted profit from a single customer relationship.Guides marketing spend and measures long-term customer loyalty.CustomerChurn RateThe percentage of customers lost during a specific period.Highlights issues in customer satisfaction and retention.ForecastingForecast AccuracyThe variance between predicted demand and actual sales.Improves future inventory planning and reduces operational costs.
By focusing on these core areas, you're gathering the specific intelligence needed to make smarter, faster decisions that directly impact growth.
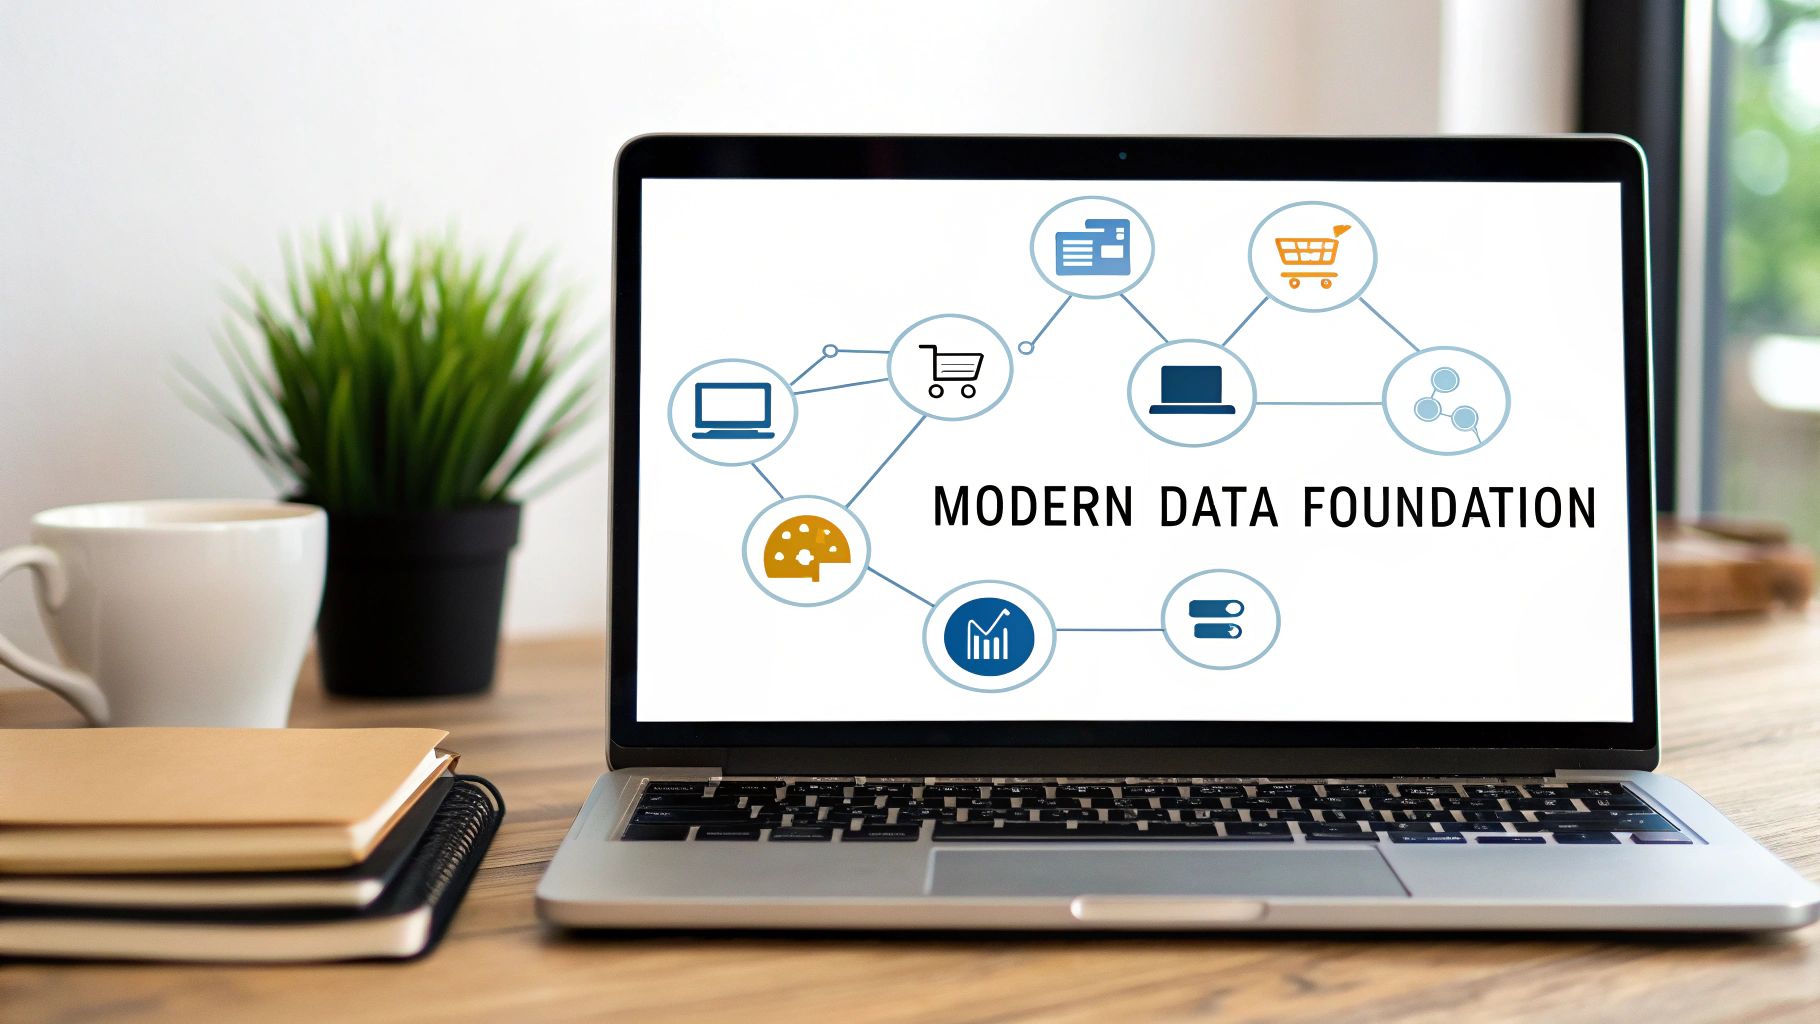
Designing Your Modern Retail Data Foundation
Your BI strategy is only as strong as its foundation. A powerful BI tool with messy, disconnected data is like a high-performance engine running on contaminated fuel—it won’t get you very far. To get real-time insights that move the needle, retailers need a modern data architecture designed for today's massive datasets.
This architecture acts as the central nervous system for your business, collecting signals from every operation and delivering clear instructions. Without it, you're left with data silos where your POS system never talks to your e-commerce platform. This disconnection gives you a fractured picture, making it impossible to answer basic questions with confidence. A modern data foundation breaks down those walls to create a single source of truth.
The Core Components of a Retail Data Stack
A modern retail data architecture has three essential layers that create a seamless flow from raw data to actionable insight.
- Data Ingestion: This layer pulls data from all your sources—POS transactions, website clicks, supply chain logs, and social media—into one central location.
- Storage and Processing: This is the heart of the system. A cloud data platform like Snowflake centralizes, cleans, and organizes all that information, preparing it for analysis.
- Visualization and Activation: This is where data becomes insight. BI tools like Tableau or Power BI connect to the processed data, turning it into interactive dashboards and reports your teams can act on.
Why Snowflake Is the Engine of Choice
Platforms like Snowflake are central to the business intelligence retail industry because they solve the challenges of scale, speed, and complexity. They are built to handle the immense data streams that modern retail generates, from millions of daily transactions to real-time online customer behavior.
The Data Cloud concept is powerful because it allows different workloads—data engineering, applications, and AI—to operate on a single, unified copy of the data. This architecture finally kills data silos.
This investment in solid data infrastructure is a massive industry shift. Retail stands out in BI spending, with global projections showing firms will pour $2.047 billion into BI solutions over the next 12 months. This investment underscores how critical BI has become for survival and growth. You can dive into the full business intelligence market report to see the scale of this change.
The ultimate goal of this data foundation is to empower every department—from merchandising to marketing—with reliable, up-to-the-minute data. When everyone works from the same numbers, decision-making becomes faster and more effective.
A well-designed data foundation on a scalable platform is the launchpad for more advanced applications, like the AI-driven automation that is defining the next era of retail. For a deeper look into getting started, consider collaborating with a Snowflake partner to build this foundation right.
Unlocking Automation with Agentic AI

Powerful dashboards show us what’s happening, but the real game-changer is what comes next: autonomous decision-making driven by Agentic AI. This is a massive leap from traditional analytics—we're shifting from passively observing data to proactively taking action on it.
Think of Agentic AI as a team of smart assistants that don't just flag problems; they solve them. A standard BI dashboard might alert you to low stock. An AI agent sees that alert, automatically generates a purchase order based on predicted demand, and places it.
This is where the business intelligence retail industry stops just reporting the news and starts making it. It's about building systems that operate, learn, and fine-tune themselves with minimal human intervention.
From Reporting Insights to Executing Actions
The true magic of Agentic AI is its ability to directly connect data to action, closing the loop between seeing an opportunity and seizing it. This is quickly becoming table stakes for any competitive retailer.
Market trends tell the same story. Cloud-based in-store analytics in North America is projected to see a 24% growth spurt from 2024-2029. And with 94% of organizations already calling BI critical, the push toward smarter, automated solutions is impossible to ignore.
- Use Case: Autonomous Inventory Management: An AI agent is plugged into your real-time POS data. It also checks local event calendars and weather forecasts. It then automatically adjusts stock levels, reordering hot-selling items before they run out and dialing back orders for products likely to see a dip in demand. The outcome is optimized stock levels and maximized sales without manual oversight.
- Use Case: Dynamic Marketing Optimization: Instead of a marketing manager manually tweaking ad budgets, an AI agent watches campaign performance across all channels. It reallocates funds in real-time, pulling money from underperforming ads and pushing it toward those driving the highest conversion rates. The outcome is a maximized return on ad spend (ROAS).
Agentic AI also enables advanced capabilities like AI-powered brand monitoring for ecommerce, which can automatically protect your brand’s reputation online.
Creating Self-Optimizing Systems
When you combine the data-crunching power of a platform like Snowflake with Faberwork LLC's expertise in Agentic AI, you create the perfect environment for these self-optimizing systems. A solid data platform provides the clean, real-time fuel that AI agents need to make smart calls.
This isn't just about efficiency. It's about building a retail operation that is resilient and incredibly adaptive. Agentic AI allows your business to react to market shifts at machine speed, giving you a serious competitive edge.
By automating these complex decisions, you free up your people to focus on strategic work that needs a human touch—like long-term growth planning, supplier relationships, and crafting a memorable customer experience.
A Practical Roadmap to BI Implementation
Getting started with business intelligence can feel massive, but breaking it down into a practical roadmap turns an intimidating project into a series of achievable wins. The trick is to start with outcomes, not technology. Let's walk through the steps to build a BI capability that delivers value right away.
The journey begins with strategy, not software. A great BI setup is built on crystal-clear business objectives. If you skip this part, you'll end up with powerful dashboards that don't answer the right questions.
Step 1: Define Your Business Goals
Before looking at a data model, nail down what you’re trying to accomplish. Are you aiming to slash inventory costs? Boost customer lifetime value? Or get smarter about pricing?
Pick a single, high-impact business problem to tackle first. For example, a great starting goal might be to reduce stockouts of your top 20 best-selling items by 50% within six months. This specific, measurable target becomes the north star for the project.
Step 2: Conduct a Data Audit
Once you have a clear goal, figure out what data you're working with. A data audit maps out your information sources. Where is your sales data stored? What about inventory levels, customer loyalty info, and website traffic?
This process almost always uncovers data silos—valuable information locked away in disconnected systems. The goal is to identify all the puzzle pieces you'll need to solve the business problem you defined in step one.
Step 3: Choose the Right Tools
Now we can talk about technology. You'll want a flexible data architecture that can grow with you. A cloud data platform like Snowflake is often the perfect centerpiece, giving you a powerful engine to process huge amounts of retail data.
Your typical BI stack will have a few key components:
- Data Integration Tools: These pull information from your different sources.
- A Cloud Data Platform: This is your single source of truth—think of Snowflake as your central hub.
- Visualization Tools: Software like Tableau or Power BI is what you'll use to build dashboards people can actually use.
Step 4: Launch a High-Impact Pilot Project
Don't try to boil the ocean. A massive, multi-year rollout is a recipe for disaster. Instead, start small with a pilot project focused on that first business goal. This lets you show value quickly, build momentum, and get key people on board.
A successful pilot project is your most powerful tool for advocacy. It proves the value of business intelligence with tangible results, making it much easier to justify further investment.
For instance, focus your pilot on optimizing inventory for just one high-value product category. A win there creates a proven blueprint you can copy across other parts of the business.
Step 5: Scale, Train, and Govern
After your pilot proves its worth, it's time to scale the solution. This means rolling out the BI platform to more departments and tackling new business problems. But scaling isn't just about tech; it’s about people.
User adoption is everything. Invest in training to ensure your teams know how to use the new tools to find insights and make smarter decisions. At the same time, set up clear data governance practices. This is what keeps your data clean, consistent, and trustworthy as your BI program grows.
Business intelligence is a continuous journey, and Faberwork LLC is the expert partner ready to guide you at every stage.
Your Questions, Answered
Jumping into business intelligence can feel like a big step. Let's cut through the noise and get straight to some of the most common questions from retailers.
How Long Does It Take to See a Return on a BI Investment?
You might be surprised. While a full, company-wide implementation is a journey, you can see a real return incredibly fast.
The trick is to not boil the ocean. Start with a focused pilot project targeting a single pain point. For instance, aiming to slash stockouts for just your top 50 products can deliver measurable financial wins—like higher sales and lower carrying costs—within a single quarter. This approach proves the value early, building momentum for a broader rollout.
Do I Need a Big IT Team to Manage a BI Platform?
Not like you used to. The days of needing a massive internal IT army to manage BI are over, thanks to modern cloud platforms like Snowflake. They handle the heavy lifting on infrastructure, freeing your data team to focus on delivering insights, not maintaining servers.
The point of a modern BI stack is to get data into the hands of the people who need it. Tools like Tableau or Power BI are designed for business users, empowering your merchandising and marketing teams to find their own answers without filing a support ticket.
This is a huge shift. It means your existing teams can become more data-savvy and self-reliant.
Can BI Help Small or Medium-Sized Retailers?
Absolutely. In fact, BI can be an incredible force multiplier for smaller retailers. You might not have the same data volume as a global behemoth, but the core challenges are the same: optimizing inventory, understanding customers, and pricing intelligently.
Cloud-based tools have made powerful analytics accessible to everyone, with pricing that scales as you grow. A medium-sized retailer can use BI to pinpoint its most profitable customer segments and focus marketing efforts there. That’s the kind of agile move that creates a serious competitive edge over bigger, slower rivals.
What Is the Biggest Mistake Retailers Make in BI Implementation?
Easy. They treat it like a technology project instead of a business strategy. Many retailers get bogged down in picking the "perfect" tool without first defining the specific business problem they're trying to solve. You end up with beautiful dashboards that don't help anyone do their job better.
To sidestep this trap, always start with why. Define a critical business goal first, like "we need to improve our gross margin by 2%." That single objective will dictate everything that follows—what data you need, which KPIs you track, and how your dashboards are designed. It ensures the entire effort is laser-focused on a meaningful business outcome.


