In a crowded market, gut feelings are a liability. Business intelligence for retailers is the process of turning raw data from sales, inventory, and customers into clear, actionable insights. It’s the shift from reacting to problems to preventing them, with one clear outcome: boosting profits and building customer loyalty by truly understanding your business.
Why Business Intelligence Is Your New Competitive Edge

Relying on intuition is a fast track to falling behind. Modern retail generates a staggering amount of data from every sale, website click, and scanned item. Business Intelligence (BI) provides the tools to translate that data into strategic advantages.
Running a retail business without BI is like navigating a city with an old paper map—you see the main streets but miss the traffic jams and faster routes. BI acts as your real-time GPS, showing you the clearest path to higher revenue, leaner operations, and excellent customer reviews.
From Guesswork to Strategic Decisions
BI transforms data from background noise into your most valuable asset. To grasp its power, it helps to understand the foundational concepts of Business Intelligence. Instead of guessing which products will sell next season, you can use historical sales data and market trends to make accurate forecasts. This data-driven approach impacts every part of your operation.
- Anticipate Customer Needs: Analyze buying habits to predict what customers want next, enabling targeted promotions that convert.
- Optimize Stock Levels: Use predictive analytics to eliminate costly overstock and frustrating empty shelves, striking the perfect inventory balance.
- Personalize Experiences: Segment customers by behavior to create marketing campaigns and in-store experiences that feel tailor-made.
Business intelligence isn't just about reports; it's about asking smarter questions. It pushes retailers beyond asking "what happened" to understanding "why it happened" and predicting "what will happen next."
The retail analytics market, a core component of business intelligence for retailers, is projected to grow from USD 10.4 billion to USD 45.2 billion by 2033. Retailers already leveraging BI are reducing stockouts by up to 30% and significantly cutting operational costs. This shift provides the clarity needed to not just survive but lead in a competitive marketplace.
Actionable Use Cases Transforming Retail Operations
The true power of business intelligence for retailers is demonstrated through practical use cases that solve everyday problems. These examples show how BI translates raw data into direct actions that stop revenue leaks, enhance customer satisfaction, and streamline operations.
Predictive Inventory Management
Inventory management is a high-stakes balancing act. Overstock ties up capital, while understock means lost sales. Traditional forecasting based on last year's sales can't keep up with modern trends.
Predictive inventory management uses BI to analyze historical sales, seasonality, market trends, and even external factors like weather. This data-driven approach predicts demand with remarkable accuracy. For more on this, explore these strategies for improving supply chain efficiency.
Outcome: Stop reacting and start proactively managing inventory. This results in optimized stock levels, a significant reduction in overstock and stockouts, and healthier cash flow. Retailers using this method often achieve up to 20% better inventory turnover and increase sales by 10-15% simply by having the right product available at the right time.
Dynamic Pricing Optimization
Static pricing leaves money on the table by failing to adapt to competitor moves, demand shifts, or inventory levels. Manually adjusting prices across thousands of products is slow, inconsistent, and impossible to scale.
Business intelligence tools automate this process by monitoring key variables in real-time:
- Competitor Pricing: Automatically track rivals to maintain a competitive edge.
- Demand Signals: Identify demand spikes and adjust prices to maximize margins.
- Inventory Levels: Automatically discount slow-moving items to clear stock efficiently.
Outcome: Pricing becomes an agile, strategic lever. You maximize profit on popular items and efficiently clear aging stock, directly boosting overall profitability and market position.
Hyper-Personalized Customer Segmentation
Generic, one-size-fits-all marketing is ineffective. It results in low engagement, wasted ad spend, and missed opportunities to build loyalty.
BI enables you to segment customers based on their behavior—purchase history, browsing activity, and campaign engagement—rather than just basic demographics.
This deep understanding fuels hyper-personalized marketing. You can identify and reward your most valuable customers (MVCs) with exclusive offers or re-engage inactive shoppers with targeted promotions. Analyzing buying patterns over time reveals crucial insights, a concept further explored when working with time series data with Snowflake.
Outcome: Marketing shifts from guesswork to precision. Campaigns become highly relevant, conversion rates increase, customer lifetime value (CLV) grows, and your marketing budget delivers a significantly higher return.
The Essential KPIs That Actually Drive Growth
It’s easy to get lost in data. Real growth comes from focusing on the Key Performance Indicators (KPIs) that provide a true pulse on your business health. While total sales are important, they don't tell the full story. Business intelligence for retailers helps you move beyond vanity metrics to uncover strategic opportunities. These KPIs should form the foundation of a BI dashboard that guides your next move.
Moving Beyond Simple Sales Data
Focusing only on top-line revenue can mask serious issues like thin margins or dead stock. To get a true sense of operational health, you need to track more granular, customer-centric metrics. Think of these KPIs as a diagnostic tool, pinpointing exactly where your business is succeeding and where it needs improvement.
By tracking these KPIs, you can make smarter investments in marketing and customer experience that deliver a clear, measurable return.
Table: Essential Retail KPIs Powered by Business Intelligence
Here's a breakdown of the crucial retail metrics that move you from basic reporting to strategic action. These are the numbers that reveal the "why" behind your sales, helping you understand customer behavior, operational efficiency, and true profitability.
KPIWhat It MeasuresStrategic Question It AnswersCustomer Lifetime Value (CLV)The total predicted profit from a single customer over their entire relationship with your brand."Are we building lasting relationships or just chasing one-off sales?"Average Transaction Value (ATV)The average amount a customer spends in a single purchase."How effective are our upselling and cross-selling strategies at the point of sale?"Gross Margin Return on Investment (GMROI)The gross margin dollars generated for every dollar invested in inventory."Is our inventory actually making us money, or is it just tying up cash?"Inventory TurnoverThe number of times inventory is sold and replaced within a specific period."Are our products flying off the shelves, or are they gathering dust?"Sell-Through RateThe percentage of units sold versus the number of units received from a supplier."Which specific products are resonating with customers and which aren't?"Foot Traffic & Conversion RateThe number of people entering a store and the percentage who make a purchase."Are we converting browsers into buyers effectively?"Customer Acquisition Cost (CAC)The total cost to acquire a new customer, including marketing and sales expenses."How much are we spending to win a new customer, and is it sustainable?"
These KPIs, when tracked together, give you a 360-degree view of your retail operation. They help you connect the dots between marketing spend, inventory management, and your bottom line, creating a clear path for sustainable growth.
Unlocking Operational Efficiency
How well are you managing your biggest asset—your inventory? Tying up capital in products that don't sell is a classic retail pitfall that modern BI makes avoidable. Two powerful KPIs provide the answer, helping you optimize stock levels and improve cash flow.
Gross Margin Return on Investment (GMROI) is the ultimate test of profitability. It answers the most important question for any retailer: "For every dollar I invest in inventory, how many dollars am I getting back in gross margin?"
A GMROI above 1.0 means you're selling goods for more than they cost. A consistently high GMROI indicates smart product selection and effective pricing.
The other key metric is Inventory Turnover, which measures how quickly you sell and replace your inventory. A high turnover rate is a positive sign—it means products are moving and capital isn't tied up in slow-moving stock. A low rate can signal overstocking, flagging product demand, or pricing issues that require immediate attention. Together, these metrics ensure every dollar invested in inventory works as hard as possible.
Building a Unified Retail Data Hub
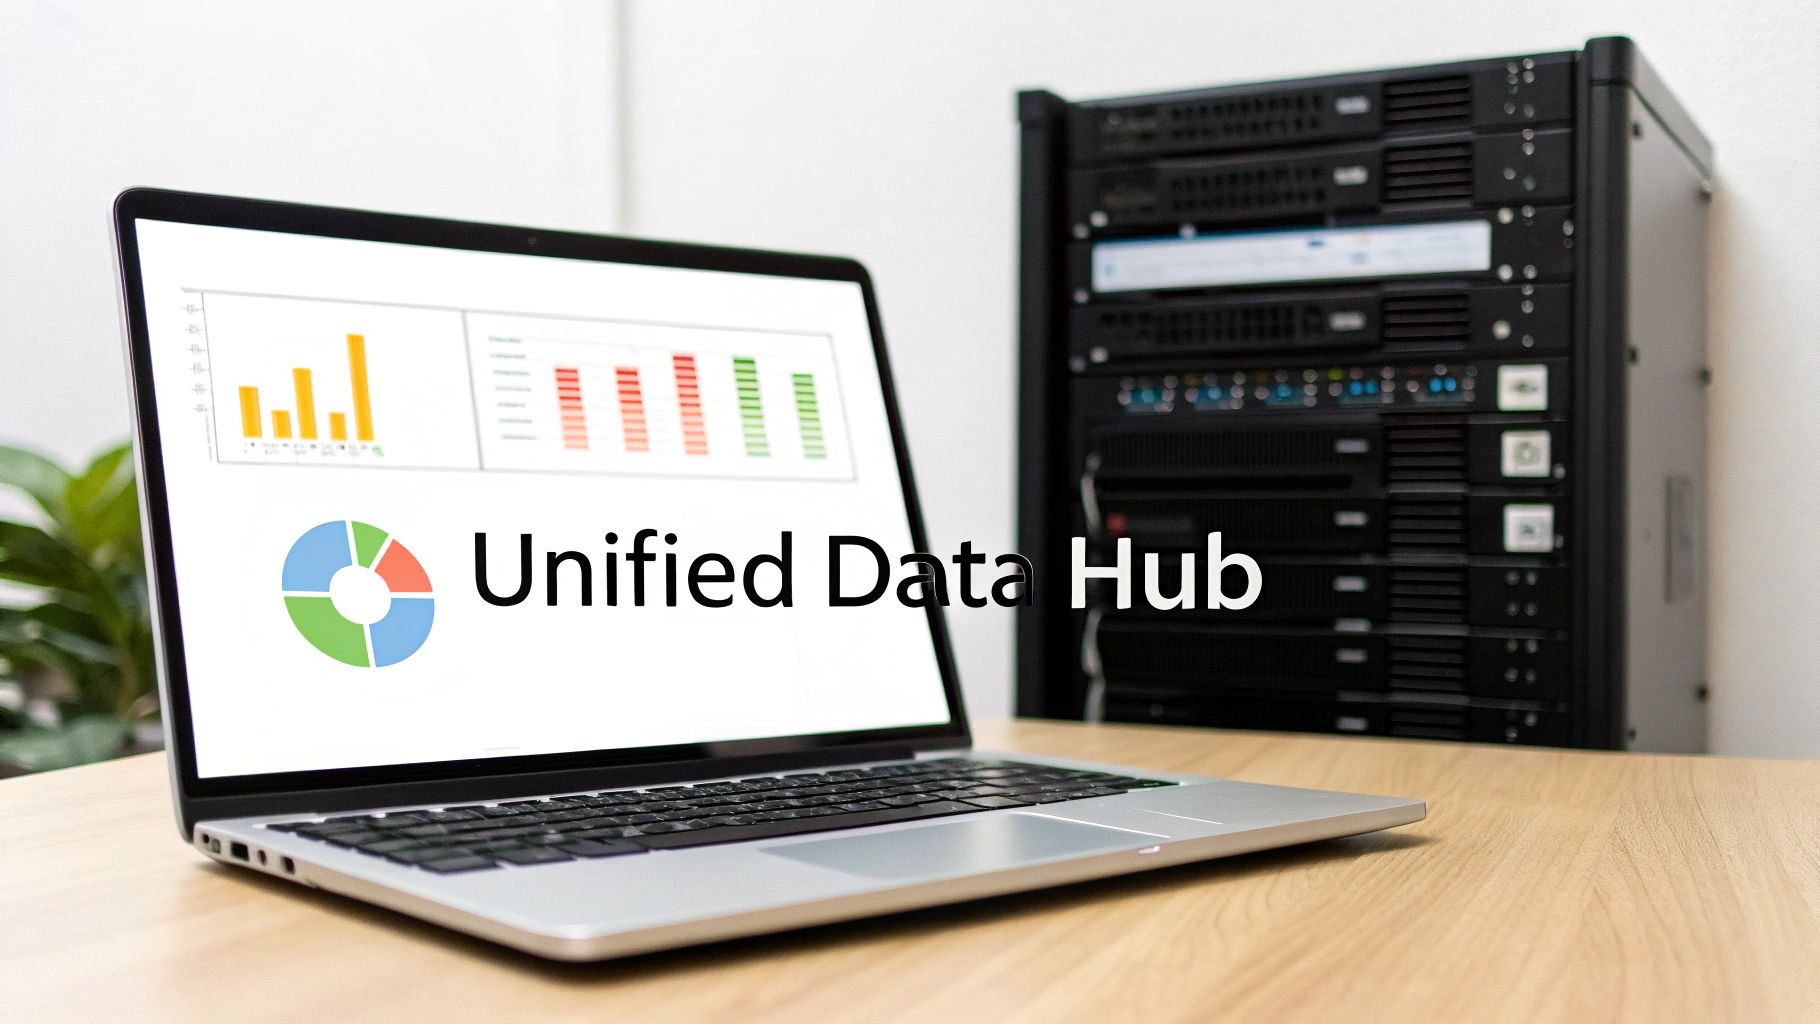
To unlock the power of BI, your data needs a single, reliable home. Currently, it’s likely scattered across your point-of-sale (POS) system, e-commerce platform, and marketing tools. This fragmentation makes a complete view of your business impossible.
A unified data hub solves this by creating a central repository for your entire retail operation. It organizes all your data in one place, making it easy to find what you need and see how different pieces connect.
The Core Components of a Modern Data Hub
Creating this "single source of truth" involves three essential components working together. This architecture is the foundation for effective business intelligence for retailers.
- Data Connectors: These tools automatically gather information from all your systems—pulling sales data from Shopify, transaction logs from registers, and campaign results from your email platform.
- Cloud Data Warehouse: This is the central hub where all raw data is cleaned, organized, and stored. Platforms like Snowflake are designed for this purpose, offering the speed and scalability to handle growing retail data.
- BI Visualization Tools: Tools like Tableau or Power BI connect to the data warehouse to build the interactive dashboards that bring your KPIs to life.
This modern stack ensures your data is trustworthy, accessible, and ready for analysis whenever you need it.
Why a Single Source of Truth Matters
The goal of a data hub is to create a single source of truth, meaning everyone in your organization—from marketing to supply chain—is working from the same verified numbers. When data lives in silos, conflicting information leads to poor decisions and internal friction.
A unified data hub eliminates time-wasting debates over whose numbers are "right." It builds a foundation of trust, ensuring strategic decisions are based on a complete and accurate view of the entire business.
The outcomes are immediate: you can handle massive amounts of data without system slowdowns, get answers to critical questions in minutes, and foster a culture where decisions are driven by facts, not feelings. For retailers looking to build this foundation, understanding the benefits of collaborating with a Snowflake partner can provide a clear path forward.
The Future of BI with AI and Automation

Traditionally, business intelligence focused on historical data—analyzing what already happened. The future of BI is proactive, using artificial intelligence (AI) and automation to make your data work for you. This transforms BI platforms from passive reporting tools into active, intelligent partners.
Imagine a system that doesn't just show last week's sales but flags a problem the moment it starts. That's the power of AI-driven analytics. This is a fundamental shift for any effective business intelligence for retailers strategy.
Proactive Anomaly Detection
One of the most powerful applications of AI is proactive anomaly detection. An AI agent can continuously monitor your most important metrics—sales, web traffic, inventory—and immediately alert you to significant, unexpected changes.
Real-world use cases include:
- Sudden Sales Dip: An AI model detects a 30% sales drop for a specific product line in your Chicago stores and instantly alerts the regional manager, enabling immediate action instead of waiting for an end-of-day report.
- Website Performance Issues: If a website update causes the mobile checkout conversion rate to plummet, the AI can spot this within minutes and notify your e-commerce and IT teams, preventing hours of lost sales.
Outcome: Your team shifts from reactive problem-solving to proactive intervention. You catch issues before they escalate into major financial problems, freeing up your analysts to focus on long-term strategy instead of daily fire-fighting.
Intelligent Automation in Action
The next step is agentic AI systems that not only send alerts but also take action. This creates a highly responsive retail operation, particularly in fast-paced areas like digital marketing.
For example, an AI agent could monitor social media sentiment. If it detects a sharp spike in negative comments about a new product, it could automatically pause the related ad campaigns on Facebook and Google, preventing further marketing spend on a failing campaign. This is made possible by social business intelligence (SBI), a field expected to grow at a CAGR of 13.0% from 2025 to 2033. Retailers using SBI have boosted conversion rates by as much as 18% by adjusting campaigns based on real-time feedback. You can explore more business intelligence market trends.
Outcome: Your BI system becomes an active participant in your daily operations, making smarter decisions faster than a human team ever could.
Your Step-by-Step Roadmap to BI Success
A brilliant strategy is useless without a solid plan. Launching a business intelligence initiative can feel overwhelming, but breaking it down into logical phases makes it achievable. This roadmap is a practical guide to successfully integrating BI into your retail organization, helping you build momentum and create a data-driven culture.
Phase 1: Define Your Core Business Objectives
Before touching any technology, answer the most important question: "What business problem are we trying to solve?" A BI project without a clear goal is destined to fail.
Focus on your most pressing challenges. Are you struggling with inventory accuracy? Losing customers? Are marketing campaigns underperforming? Establishing specific, measurable goals from the outset will guide every subsequent decision, from data source selection to your first dashboard's KPIs.
Phase 2: Identify Critical Data and Choose Your Technology
With clear objectives, identify the data needed to achieve them. To boost customer retention, you'll need data from your CRM, POS system, and e-commerce platform. Map these key sources to understand the integration work required.
Next, select your technology stack, which typically includes:
- Data Integration Tools to pull data from your various systems.
- A Cloud Data Warehouse like Snowflake to act as the central storage hub.
- A BI Visualization Tool such as Tableau or Power BI to create user-friendly dashboards.
Choose a tech stack that is both scalable and easy to use. The goal is to empower your team, not create a barrier for non-technical users.
Phase 3: Launch a Pilot Project and Govern Your Data
Avoid a company-wide rollout from day one. Instead, start with a focused pilot project. Choose one key objective from Phase 1 and build a solution for that specific problem—for example, a dashboard that tracks sell-through rates for a single product category.
This approach demonstrates value quickly, builds stakeholder buy-in, and allows you to learn on a manageable scale. A successful pilot creates the momentum needed for a broader implementation.
Simultaneously, establish a solid data governance framework. Define who owns the data, who can access it, and how you will ensure its accuracy and consistency. Without good governance, your BI system is built on shaky, untrustworthy data, rendering your insights worthless. Strong governance is the foundation of any successful business intelligence for retailers program.
Your Questions, Answered
Jumping into the world of retail data can feel complex. Let's tackle some of the most common questions that come up when retailers start exploring business intelligence.
How Much Is This Going to Cost Me?
The cost varies depending on your operational scale, data volume, and chosen tools. Modern, cloud-based BI platforms often use flexible subscription models, making them affordable for small and mid-sized retailers.
However, viewing this purely as a cost is the wrong approach. It's an investment.
The real question isn't the price tag but the return on investment (ROI). When you factor in savings from smarter inventory management and increased sales from targeted promotions, the initial outlay becomes a clear business case. Start with a focused pilot project to prove the value, then scale.
What Kind of Team Do I Need to Hire for This?
You don't need a large team of data scientists. A modern retail BI team can be lean, often starting with a single data analyst skilled in building dashboards and extracting insights.
The most critical component isn't a technical role; it's fostering data literacy across your entire organization—merchants, marketers, and store managers. The goal is to empower them to use dashboards for daily decision-making. Many of today's best BI tools are designed with intuitive interfaces for these non-technical users.
Can BI Actually Connect My In-Store and Online Data?
Yes, absolutely. This is one of the most powerful outcomes of business intelligence for retailers. A properly designed BI system consolidates data from all your channels and systems.
Think of it as a central hub that connects information from:
- In-store point-of-sale (POS) terminals
- E-commerce platforms like Shopify or Magento
- Inventory management software
- Customer loyalty programs and your CRM
By unifying this data, you achieve a complete, omnichannel view of your customer. You can track who browses online before buying in-store or which displays drive online traffic, giving you a truly integrated understanding of your business.


