Business intelligence for retail turns mountains of raw data into clear, actionable insights that drive smarter decisions. It’s the engine that powers everything from stocking shelves to personalizing marketing campaigns, helping you boost your bottom line and build lasting customer loyalty by replacing guesswork with hard data.
How Business Intelligence Transforms Retail Decisions
Imagine managing a flagship store blindfolded. You wouldn’t know which products were selling, how long the checkout lines were, or where to restock. Running a retail business without BI is similar—you're surrounded by disconnected data from sales, inventory, and customer feedback, forced to operate on instinct.

A BI platform removes the blindfold, acting as a central command center for your entire operation. It integrates data from every corner of your business—POS systems, e-commerce platforms, inventory logs, and CRM data—into a unified, easy-to-understand view.
From Reactive Problems to Proactive Strategy
Without BI, retail teams are stuck reacting to problems. A manager only learns a popular item is out of stock when a customer complains, resulting in a lost sale.
With BI, that same manager sees sales trends in real-time and can reorder hot-ticket items before they run low. This shift from reacting to problems to proactively shaping strategy is the core outcome of business intelligence for retail.
A strong BI strategy lets retailers move beyond asking what happened. It empowers them to understand why it happened and, more importantly, predict what will happen next, turning insights into a competitive advantage.
Unifying Your Operational View
A modern retail business generates a constant stream of data. A BI system connects these disparate sources into one cohesive picture, revealing critical insights that would otherwise stay buried.
By integrating data from key sources, you can answer complex questions and drive specific outcomes:
- Point-of-Sale (POS) Systems: Track transactions to optimize checkout staffing and payment options.
- Inventory Management Software: Monitor stock levels to reduce carrying costs and prevent stockouts.
- E-commerce Platforms: Analyze online traffic to improve conversion rates and user experience.
- Customer Relationship Management (CRM) Data: Understand purchase history to build targeted loyalty campaigns.
Connecting these dots reveals how an online marketing campaign drives in-store foot traffic or which promotions resonate with specific customer segments. The promise of BI isn't just generating reports; it's making faster, smarter decisions that boost sales, optimize stock, and build lasting customer loyalty.
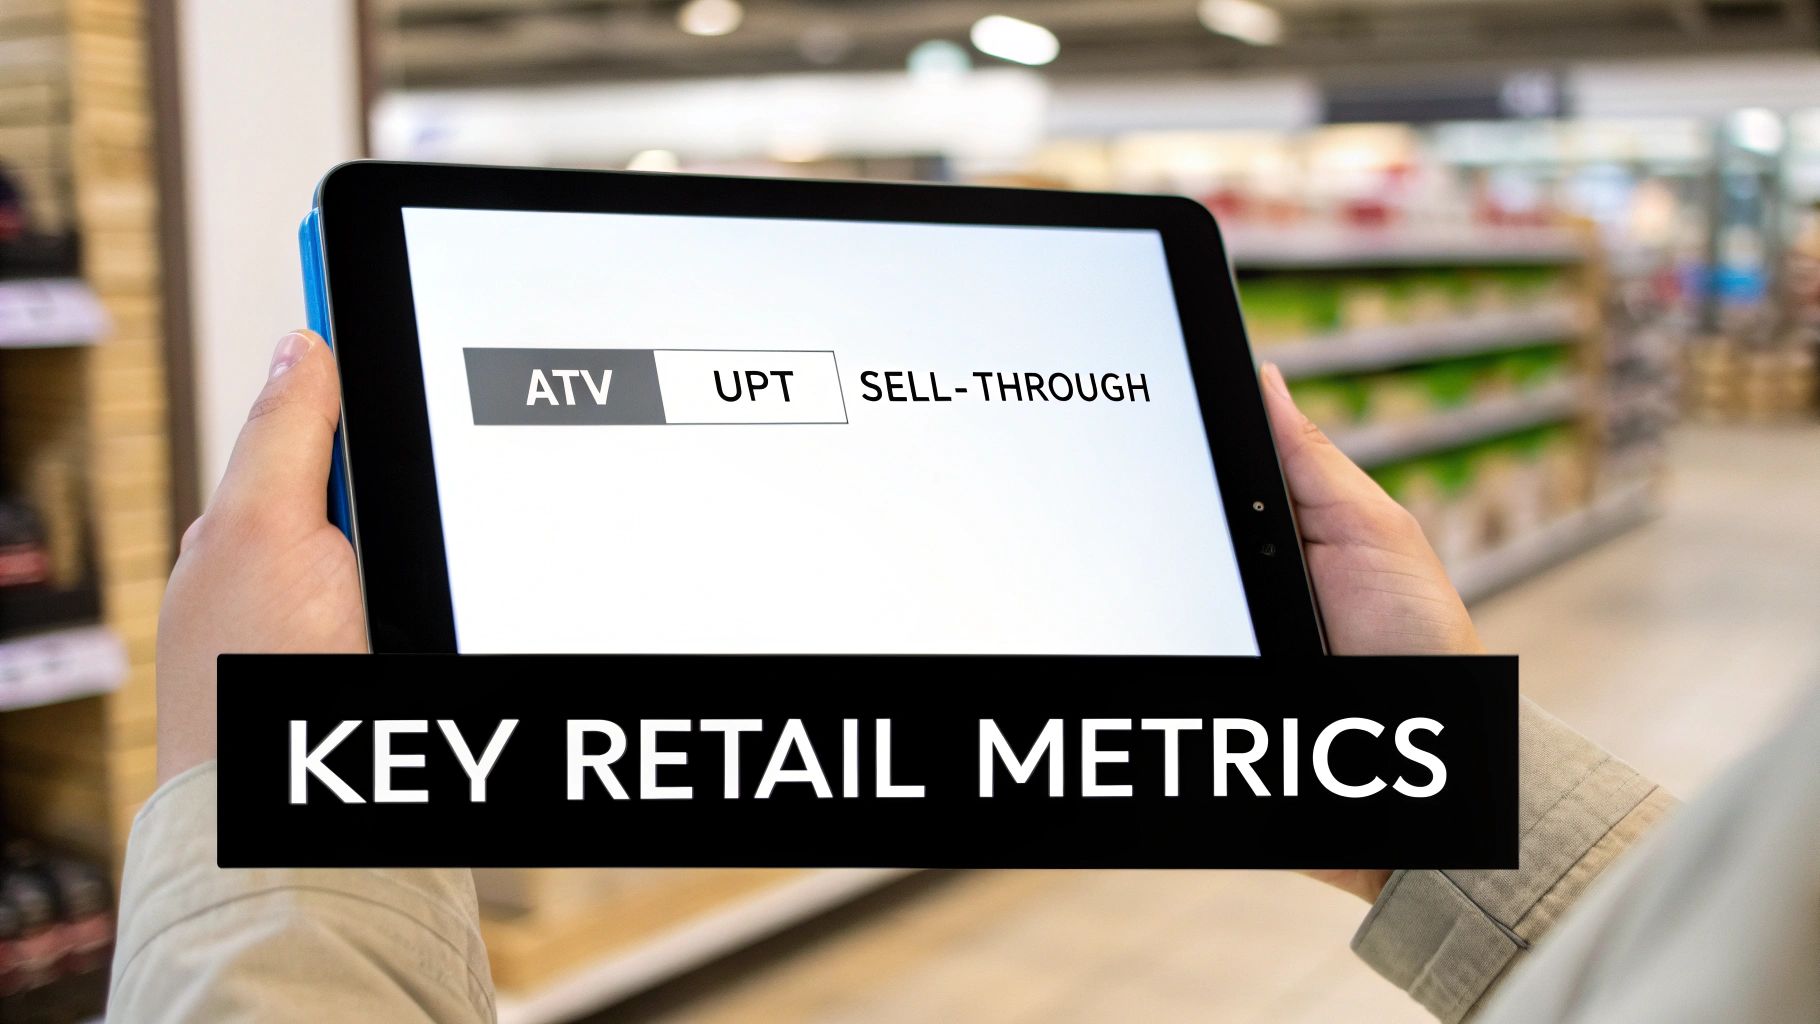
The Core Metrics That Drive Retail Success
In the competitive world of retail, success is measured in numbers. Effective business intelligence for retail focuses on the key performance indicators (KPIs) that reveal the health of your business and uncover the "why" behind every transaction, stock movement, and customer interaction.
This data-driven approach is no longer optional. Over 33% of large businesses now use decision intelligence, and the retail and e-commerce sector of the social BI market is projected to grow at a 13.0% CAGR through 2033. With 94% of organizations stating analytics are critical to their growth, a data-first strategy is essential. You can discover more insights about the growth of the social BI market to see the rapid pace of adoption.
The following table highlights essential KPIs and the business outcomes they drive, serving as a guide for turning raw data into profitable decisions.
Essential Retail KPIs and Their Business Impact
KPI CategoryKey Performance Indicator (KPI)What It MeasuresOutcome-Driven Question It AnswersSales PerformanceAverage Transaction Value (ATV)The average amount a customer spends in one purchase.Are our upselling and cross-selling tactics increasing basket size?Sales PerformanceUnits Per Transaction (UPT)The average number of items a customer buys in one purchase.How can we optimize product placement to encourage add-on purchases?Sales PerformanceSales Per Square FootThe revenue generated for every square foot of sales space.Is our store layout maximizing profitability?Inventory ManagementInventory TurnoverHow many times inventory is sold and replaced over a period.Are we efficiently moving stock to minimize carrying costs?Inventory ManagementSell-Through RateThe percentage of units sold versus units received.Is this new product resonating with customers?Inventory ManagementGross Margin Return on Investment (GMROI)The gross profit earned for every dollar invested in inventory.Is our inventory generating a healthy profit?Customer ExperienceCustomer Lifetime Value (CLV)The total projected profit from a single customer over time.Which customer segments are most valuable and worth investing in?Customer ExperienceCustomer Retention RateThe percentage of customers who return to shop again.Are our loyalty programs effectively driving repeat business?
Tracking these metrics together allows you to see the connections between your sales floor, warehouse, and customer behavior, building a complete picture of business performance.
Mastering Inventory Management
Inventory is a critical asset that can quickly become a liability. Too much stock ties up cash; too little leads to lost sales. BI provides the clarity needed to strike the right balance.
Effective inventory management isn't about having the most stock; it's about having the right stock, in the right place, at the right time. BI makes this precision possible.
Here are the key metrics and the outcomes they drive:
- Inventory Turnover: A high turnover indicates strong demand and efficient purchasing. Use this KPI to identify slow-moving products and free up capital by reducing overstock.
- Sell-Through Rate: This metric directly measures product performance. A high rate validates a successful launch or promotion, guiding future buying decisions.
- Gross Margin Return on Investment (GMROI): The ultimate profitability metric for inventory. A GMROI above 1 confirms your buying and pricing strategies are generating profit.
Understanding the Customer Experience
Retail success is built on customer loyalty. Business intelligence makes intangible concepts like "satisfaction" measurable, turning sentiment into hard data that steers marketing and service strategies.
- Customer Lifetime Value (CLV): This predictive metric estimates the total profit from a single customer. Use CLV to justify investments in acquiring and retaining high-value shoppers.
- Customer Retention Rate: It costs far less to retain an existing customer than to acquire a new one. A high retention rate directly improves profitability and signals that your loyalty and service efforts are working.
Powerful Retail BI Use Cases in Action
Knowing your metrics is one thing; using them to drive business outcomes is another. The true power of business intelligence for retail is solving high-stakes challenges and turning data into a measurable return on investment. Here are a few outcome-focused scenarios where BI makes a tangible difference.
Outcome 1: Slashing Costs with Demand Forecasting
Problem: A national home goods chain suffered from constant stockouts of popular items during peak seasons while their warehouses were filled with slow-moving products, tying up cash and incurring high carrying costs.
Solution: They implemented a BI solution to analyze historical sales data alongside external factors like seasonal trends and local holidays. This created a highly accurate demand forecasting model.
Results:
- Reduced Carrying Costs: By identifying and clearing out overstocked items, the company cut inventory carrying costs by 15% in the first year.
- Minimized Stockouts: Predictive ordering slashed stockout incidents by over 40% during their busiest quarter, capturing previously lost sales.
- Improved Cash Flow: With less capital tied up in unsold inventory, the retailer freed up funds for new product lines and marketing campaigns.
Outcome 2: Boosting Engagement with Customer Segmentation
Problem: A fast-fashion brand’s generic email blasts were delivering poor open rates and conversions. They needed to personalize their communication to resonate with different customer groups.
Solution: Using a BI platform, they analyzed customer purchase histories, browsing behavior, and loyalty data to segment their audience into distinct groups based on habits and preferences.
Results:
- Increased Conversion Rates: Instead of one-size-fits-all promotions, they sent tailored offers—early access for VIPs, targeted discounts for bargain hunters. This led to a 25% increase in campaign conversion rates.
- Higher Customer Lifetime Value (CLV): Personalized engagement made customers feel understood, strengthening loyalty and boosting long-term value.
Outcome 3: Maximizing Profit with Dynamic Pricing
Problem: An electronics retailer struggled to keep up with rapid price changes in a competitive market. Manual adjustments were slow, causing them to lose sales by being priced too high or leave money on the table by being priced too low.
Solution: They deployed a dynamic pricing strategy fueled by BI. The tool continuously scanned competitor prices, analyzed internal stock levels, and factored in market demand trends to provide automated pricing recommendations.
Results:
- Optimized Margins: If a competitor ran out of a popular TV, the system suggested a small price increase to capture higher-margin sales. If their own inventory was high, it recommended a strategic discount to move products faster. This agility maximized profit on every sale.
Outcome 4: Improving Efficiency with Logistics Optimization
Problem: A grocery chain was losing money due to supply chain inefficiencies like delivery delays, product spoilage, and suboptimal truck routes. The complexity of their network made it difficult to pinpoint the root causes.
Solution: They integrated data from fleet management systems, warehouse logs, and in-store POS terminals into a unified BI dashboard. This provided a complete view of their logistics network, visualizing everything from delivery times to fuel costs. For more on the technical approach, see how companies are enhancing logistics with Python data analytics.
Results:
- Reduced Spoilage & Delays: Visibility into the entire supply chain helped them spot bottlenecks, reroute trucks for efficiency, and adjust delivery schedules based on real-time sales data from individual stores, leading to a more resilient and cost-effective operation.
Building Your Modern Retail Data Architecture
A powerful business intelligence strategy requires a modern data architecture. Think of it as a high-tech distribution center for your information. Data from POS systems, e-commerce platforms, and supply chain logs are incoming shipments. A modern data architecture receives, sorts, stores, and dispatches this information with speed and precision, ensuring your teams get the insights they need.

The Key Components of a Retail Data Stack
This "distribution center" has a few core components that work together to turn raw data into actionable intelligence.
- Data Sources: Your 'incoming shipments,' including transaction logs, website clickstream data, and warehouse inventory levels.
- Integration and Transformation: The 'sorting system.' Tools pull data from all sources, clean it for consistency, and load it into a central repository, creating a single source of truth.
- Cloud Data Platform: The vast 'warehouse' itself. A platform like Snowflake acts as a central hub where all your organized data is stored securely and is instantly accessible for analysis.
- BI and Analytics Tools: Your 'logistics managers.' They connect to the data platform and present information in easy-to-understand dashboards and reports.
Why a Cloud Platform Like Snowflake is a Game-Changer
Traditional data warehouses were rigid and expensive to scale. A modern cloud data platform offers the agility and scalability that today's retail environment demands.
A cloud-based architecture allows you to handle massive data volumes from Black Friday sales surges and complex queries like time-series analysis without system slowdowns or costly hardware upgrades.
The following diagram shows how a modern data platform centralizes different data types, making comprehensive analysis possible.
This structure breaks down silos, unifying information from marketing, supply chain, and store operations. This unified view is the key to unlocking deeper insights into customer behavior and operational efficiency. You can learn more about managing complex workloads like time-series data with Snowflake for better forecasting.
Building this architecture is a strategic decision that empowers every department to make smarter, faster decisions based on a complete and trusted view of the business. It’s the essential backbone for any successful business intelligence for retail initiative.
Supercharging Retail Insights with AI and Automation
Business intelligence tells you what happened. Artificial intelligence (AI) tells you what’s likely to happen next. Integrating AI and machine learning (ML) into your BI platform upgrades your analytics from a rear-view mirror to a predictive navigation system, giving you a powerful competitive edge.

This is a fundamental shift in retail operations. The global retail analytics market, a core component of business intelligence for retail, grew from $8.66 billion to a projected $10.77 billion in just one year, driven by the need for advanced analytics. To see what's behind this trend, you can read the full research on the retail analytics market.
From Reporting to Predicting
Traditional BI answers questions about the past: "What were our sales last month?" An AI-powered system answers questions about the future: "Which customers are most likely to churn in the next 60 days?" This moves your team from analyzing history to actively shaping future outcomes.
AI doesn't replace business intelligence; it supercharges it. By automating complex analysis and spotting patterns a human might miss, AI frees your teams to focus on strategy and action.
Practical AI Use Cases in Retail
The applications of AI in retail deliver a direct impact on the bottom line by learning from your historical data to make accurate predictions.
- Hyper-Accurate Demand Forecasting: An ML model can analyze how an unexpected snowstorm and a local sporting event will specifically impact demand for rock salt and hot chocolate at a single store, far beyond standard seasonal forecasts.
- AI-Powered Churn Prediction: An AI model detects subtle changes in a customer’s buying habits to flag them as "at-risk" long before they stop shopping, enabling proactive retention campaigns with personalized offers.
- Smarter Product Recommendations: AI algorithms analyze purchase data to power "customers who also bought" suggestions, significantly lifting Average Transaction Value (ATV) online and in-store.
Automating Insights for a Competitive Edge
The goal is to make data-driven decision-making faster and easier. AI handles the heavy lifting—finding sales anomalies, automatically segmenting customers, and summarizing complex dashboards. This frees up your teams to focus on what to do with the insights, giving your organization the ability to anticipate market and customer behavior.
Your Roadmap to BI Implementation and Governance
A successful business intelligence program is built with intention, not just bought off the shelf. A practical roadmap is required to align powerful technology with tangible business goals, ensuring the solution delivers a clear return on investment.
The process starts with one question: what business outcome are you trying to achieve? Are you aiming to slash inventory costs, improve marketing ROI, or optimize store staffing? Pinpointing these specific, outcome-focused objectives is the most critical first step, guiding every subsequent decision. Without this clarity, BI projects risk becoming expensive data collection exercises with no real-world impact.
The Phased Approach to Implementation
Instead of a risky "big-bang" rollout, a phased approach breaks the implementation into manageable stages. This strategy demonstrates value quickly, builds momentum, and fosters excitement across the organization.
This step-by-step journey typically follows four key stages:
- Define Business Goals: Identify pressing challenges that business intelligence for retail can solve.
- Select the Right Technology: Choose a BI platform and data architecture that can scale with your business.
- Launch a Pilot Program: Start small with a focused project, like analyzing sell-through rates for one product category, to prove the concept and secure stakeholder buy-in.
- Scale and Expand: Use the pilot's success to justify a broader rollout to other departments and use cases.
This methodical approach minimizes risk and cultivates a data-driven culture by showing the value of BI, not just talking about it.
Establishing Robust Data Governance
As you implement your BI solution, establishing strong data governance is essential. Governance is the rulebook that ensures everyone in the company can trust the data they are using. Without it, you get conflicting reports, data silos, and a lack of confidence in the insights being generated.
Governance creates a 'single source of truth.' It’s a framework of standards and policies that ensures your data is accurate, consistent, secure, and used responsibly across the business.
This framework is critical as the market for BI tools continues to grow. The global business intelligence software market is projected to reach $151.26 billion by 2034, with North America currently holding a 38% share. This growth highlights the importance of a solid foundation to manage all that data. You can discover more about the growing BI software market to understand the industry's trajectory. A crucial step is building a governance council with members from IT, finance, and operations to create a reliable data ecosystem that empowers your entire team.
Frequently Asked Questions About Retail BI
Even after seeing the potential, diving into business intelligence for retail can raise a few questions. Here are answers to some of the most common ones.
How Can We Prove the ROI of a New Retail BI Platform?
Focus on tangible business outcomes from the start. Launch a targeted pilot project focused on a single, high-impact area, such as reducing inventory carrying costs for a key product category or improving the conversion rate of a digital marketing campaign.
Measure baseline KPIs before you start, then track the improvement. Showing a 10% reduction in stock costs or a 15% lift in conversion rates presents a powerful case in clear dollar terms—money saved or new revenue generated—justifying further investment.
How Do We Get Our Teams to Actually Use the Tools?
Adoption hinges on making the tool a simple solution to daily challenges. If a BI platform isn't intuitive and relevant, it won't be used.
- Involve Your Teams Early: Include store managers and buyers in the design process to ensure dashboards answer the questions they face every day.
- Provide Role-Specific Training: Show teams exactly how the tool makes their specific job easier, whether it's checking stock levels or analyzing weekly sales trends.
- Champion a Data-First Culture: When leadership consistently uses BI dashboards to guide meetings and strategic decisions, it signals that data is a core business asset, encouraging widespread adoption.
What Is the Difference Between BI and Retail Analytics?
Think of it like driving a car. BI is the rearview mirror, and analytics is the GPS.
Business Intelligence (BI) provides a clear picture of what happened in the past and what is happening now. It answers "what" questions like, “What were our total sales last quarter?” or “Which products are our current bestsellers?”
Retail Analytics uses that same data to look ahead and suggest a route. It answers predictive and prescriptive questions like, “What are our sales likely to be this holiday season?” or “What is the optimal discount to clear inventory without destroying our margin?”
In short, BI tells you what happened. Analytics predicts what will happen next and suggests what you should do about it.


