Business intelligence in retail turns mountains of raw data into sharp, actionable insights that directly drive sales, optimize inventory, and create memorable customer experiences. It’s a fundamental shift from reviewing past performance to using real-time data to predict future trends and act on them decisively.
Why Data Is the New Currency in Retail
Running a modern retail operation without data is like navigating a city with an outdated map. Business Intelligence (BI) is your live GPS, converting sales figures, inventory logs, and customer feedback into a dynamic guide that reveals the most profitable path forward.
Successful retailers no longer rely on guesswork. They use data to make proactive decisions with a measurable impact on their bottom line. This guide provides a blueprint for technology leaders, focusing on powerful, real-world applications and the outcomes they deliver.

From Information Overload to Actionable Insight
For years, retailers drowned in data from disconnected systems—sales figures, supply chain logs, and loyalty programs—without clear direction. BI acts as a universal translator, unifying this information to tell a coherent story about your business.
This data-first approach is now a core operational requirement. The global retail analytics market is expected to hit $15.8 billion by 2026, growing at 20.3% annually. This explosive growth signals a major market shift: intelligence is the ultimate competitive advantage.
Business intelligence isn’t just about generating reports. It’s about building a culture where every decision—from product placement to marketing campaigns—is backed by solid evidence to achieve a specific outcome.
The Tangible Outcomes of Retail BI
A well-executed BI strategy delivers concrete results across the entire organization by enabling smarter, faster, and more profitable decisions.
Key outcomes include:
- Increased Profitability: Achieved by optimizing prices, reducing waste, and maximizing marketing spend ROI.
- Enhanced Customer Loyalty: Driven by personalized offers that reflect a true understanding of shopper behavior.
- Improved Operational Efficiency: Realized through automated inventory management and a streamlined supply chain.
For more on this, explore these insights on understanding why Business Intelligence is crucial for SMBs. The principles of turning data into a strategic asset apply universally, proving that smart BI can level the playing field.
Putting BI to Work: Practical Use Cases and Outcomes
The real value of business intelligence is realized when applied to the daily challenges of retail. Here, data moves from abstract numbers to a tangible return on investment, replacing gut feelings with evidence-based action. If you need a refresher on the basics, you can find a good overview of Business Intelligence here.
Each use case connects a common retail problem to a data-backed solution and, most importantly, its measurable business outcome.
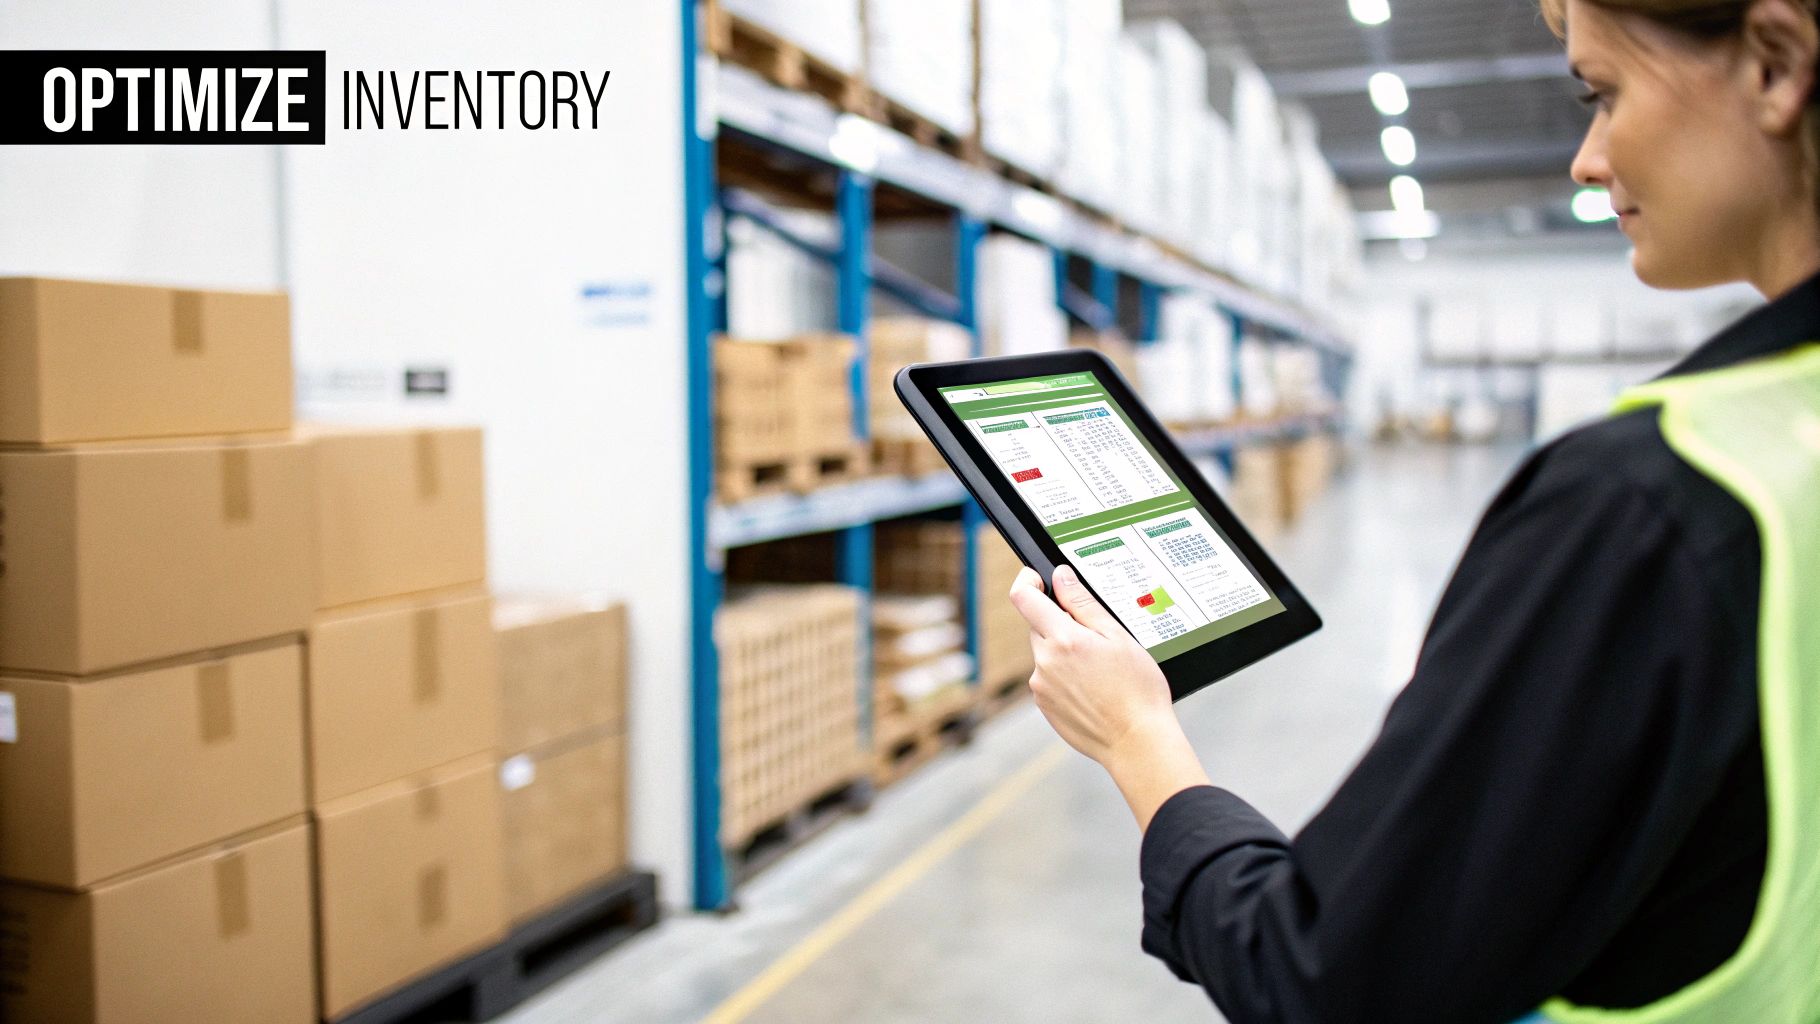
Use Case 1: Predictive Inventory Management
Problem: Overstocking ties up capital, while stockouts lead to lost sales and frustrated customers. BI Solution: Use predictive analytics on historical sales data, seasonal trends, and external factors like local events to forecast demand with high accuracy. This automates and refines ordering parameters. Outcome: A significant reduction in both overstock and stockout events, leading directly to improved cash flow and higher sales revenue.
Use Case 2: Dynamic Pricing Optimization
Problem: Inaccurate pricing leaves money on the table or sends customers to competitors. BI Solution: Monitor competitor prices, customer demand signals, and inventory levels in real time. For example, a slow-moving item can be automatically discounted to clear space, while a popular, low-stock item might receive a slight price increase to maximize profit. Outcome: Surgical price adjustments that increase profit margins on every item without sacrificing sales volume.
Use Case 3: Supply Chain Visibility and Efficiency
Problem: Complex supply chains with hidden bottlenecks cause costly delays and empty shelves. BI Solution: Gain end-to-end visibility to track shipments, monitor supplier performance, and optimize logistics for speed and cost-efficiency. Use Case Example: Walmart uses advanced analytics to slash inventory costs while ensuring shelves remain stocked, analyzing historical sales and external variables to optimize its entire network. Outcome: A streamlined supply chain with fewer delays, reduced shipping costs, and improved on-time delivery rates. A full 80% of retail executives are expected to adopt AI-powered supply chain tools by 2025 to achieve similar results.
By providing end-to-end visibility, BI helps identify bottlenecks before they become major problems. It allows managers to track shipments, monitor supplier performance, and optimize logistics for speed and cost-efficiency.
Use Case 4: Deep Customer Analytics and Personalization
Problem: Anonymous transaction data fails to reveal who your customers are or what they truly want. BI Solution: Transform transaction data into rich customer profiles that uncover buying patterns, product affinities, and lifetime value. Use these insights to create highly personalized marketing campaigns and product recommendations. Outcome: Stronger customer relationships and increased loyalty, leading to higher lifetime value. For a technical look at a related area, check out our guide on enhancing logistics with Python data analytics.
To summarize, here is how these BI applications translate into direct business results.
Key Retail BI Applications and Their Business Outcomes
BI Application AreaBusiness Problem SolvedMeasurable OutcomeInventory ManagementOverstocking and stockoutsReduced carrying costs by 10-25%; Increased sales from higher availabilityPricing OptimizationInaccurate pricing and missed margin opportunitiesProfit margin improvement of 2-5% through dynamic pricingSupply Chain VisibilityInefficiencies, delays, and hidden costsReduced shipping costs by 5-15%; Improved on-time delivery ratesCustomer AnalyticsLack of personalization and low customer loyaltyIncreased customer lifetime value (CLV) by 10-20%; Higher campaign ROI
Each application targets a specific, costly problem and delivers a quantifiable improvement, turning data into a powerful profit driver.
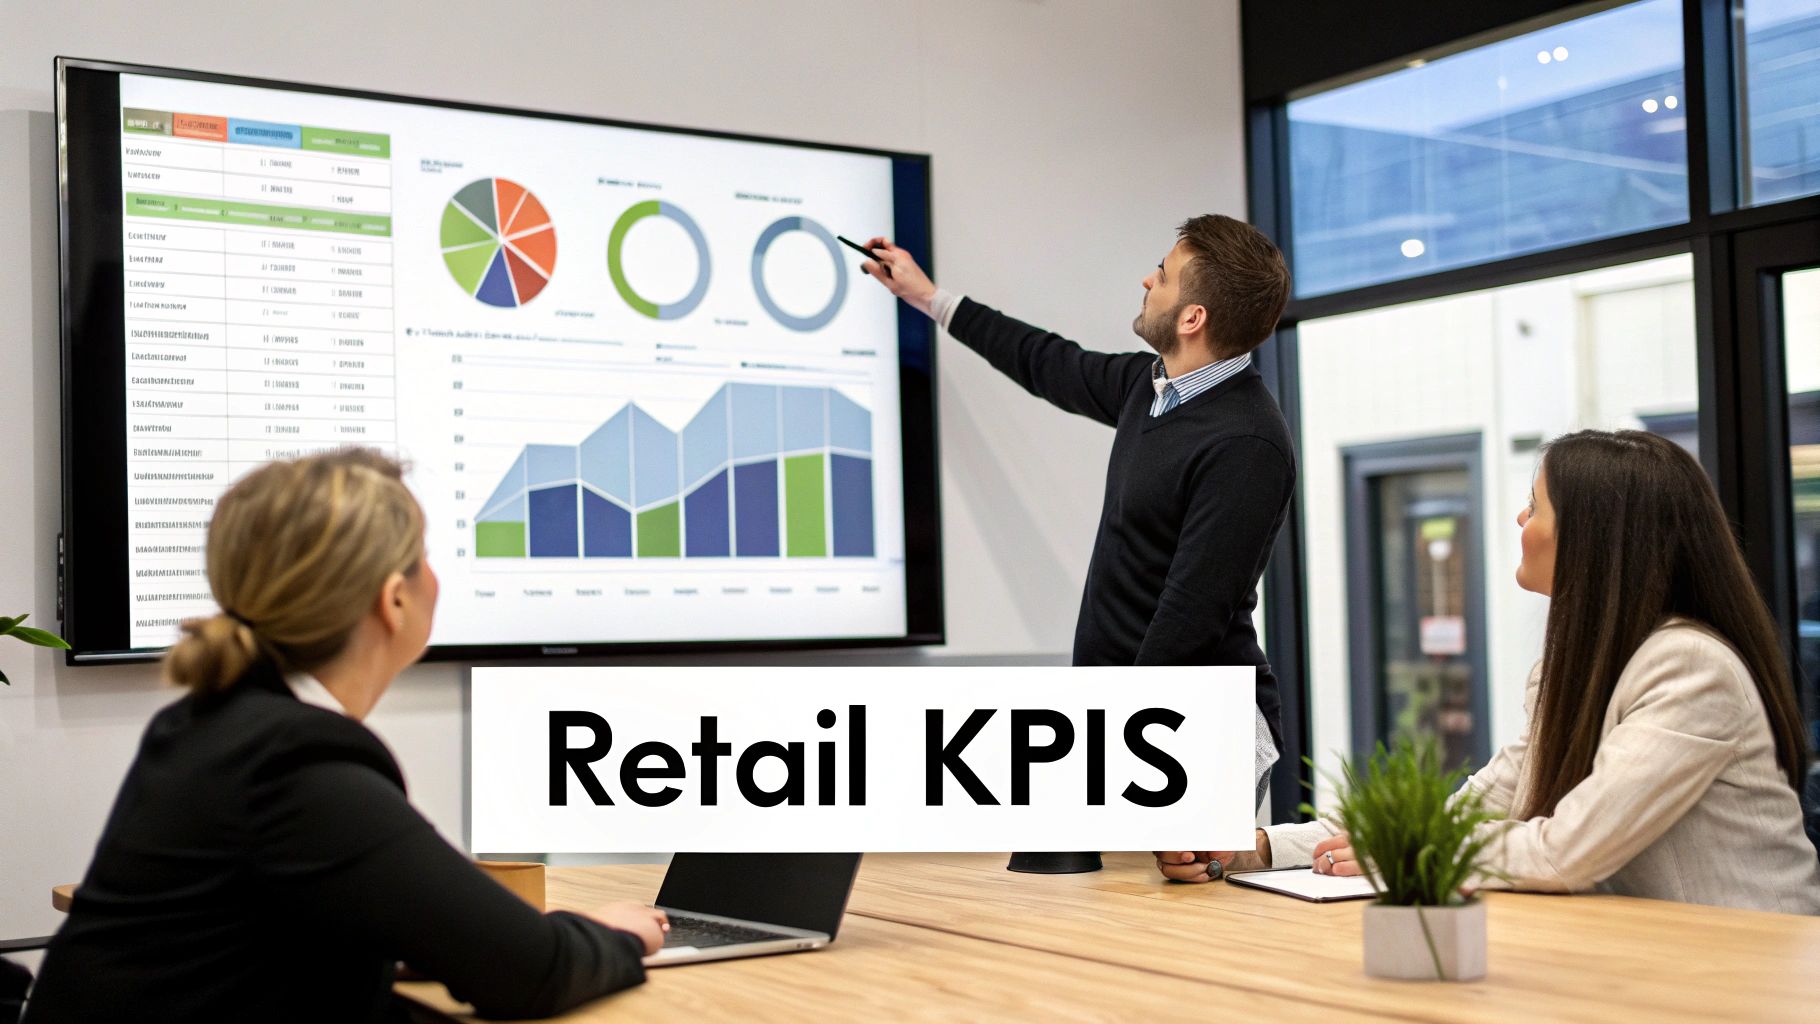
Tracking Success with the Right Retail KPIs
Implementing business intelligence tools is the first step; measuring their impact is what proves their value. Key Performance Indicators (KPIs) are the scoreboard for your retail business, translating oceans of data into clear signals of success or failure.
Modern BI dashboards bring these numbers to life, replacing static reports with real-time visuals of your most critical metrics. This empowers managers to spot trends as they emerge, identify opportunities, and align the entire team around shared, measurable goals. This fosters a culture where performance is a tangible, trackable reality.
Core Metrics That Drive Strategic Decisions
Focusing on the right KPIs is what separates high-performing retailers from the rest. While every business is unique, a handful of core metrics consistently provide the deepest insights into financial health, operational efficiency, and customer satisfaction.
Top retailers don't track hundreds of metrics. They select a few KPIs that tie directly to their overarching strategy and answer critical questions: Are we selling the right products? Are our customers returning? Is the business truly growing?
Here are some of the most powerful retail KPIs to watch:
- Customer Lifetime Value (CLV): Predicts the total profit from a customer over their entire relationship with your brand. A rising CLV indicates that your products, service, and loyalty programs are succeeding.
- Inventory Turnover: Measures how quickly you sell and replace inventory. A high turnover signals strong sales and efficient purchasing; a low rate may indicate overstocking or waning demand.
- Average Transaction Value (ATV): Shows the average amount a customer spends per purchase. It’s a direct measure of shopper behavior and the effectiveness of upselling tactics.
- Gross Margin Return on Investment (GMROI): Evaluates how effectively you turn inventory into cash, minus its cost. A GMROI above 1.0 confirms you are making a profit on the products you sell.
By tracking these KPIs, you create a feedback loop. The data shows you what's working and what isn't, allowing for quick adjustments to strategy, from marketing spend to inventory purchasing, ensuring decisions are always grounded in performance.
Visualizing KPIs for Actionable Insights
The real power of integrating business intelligence and retail is realized when these KPIs are displayed on a dynamic dashboard. A store manager can glance at a screen to see daily sales versus targets, identify top-selling products in real time, and check stock levels instantly.
This immediate access to information empowers everyone, from the stockroom to the boardroom, to make smarter, faster decisions that directly impact the bottom line.
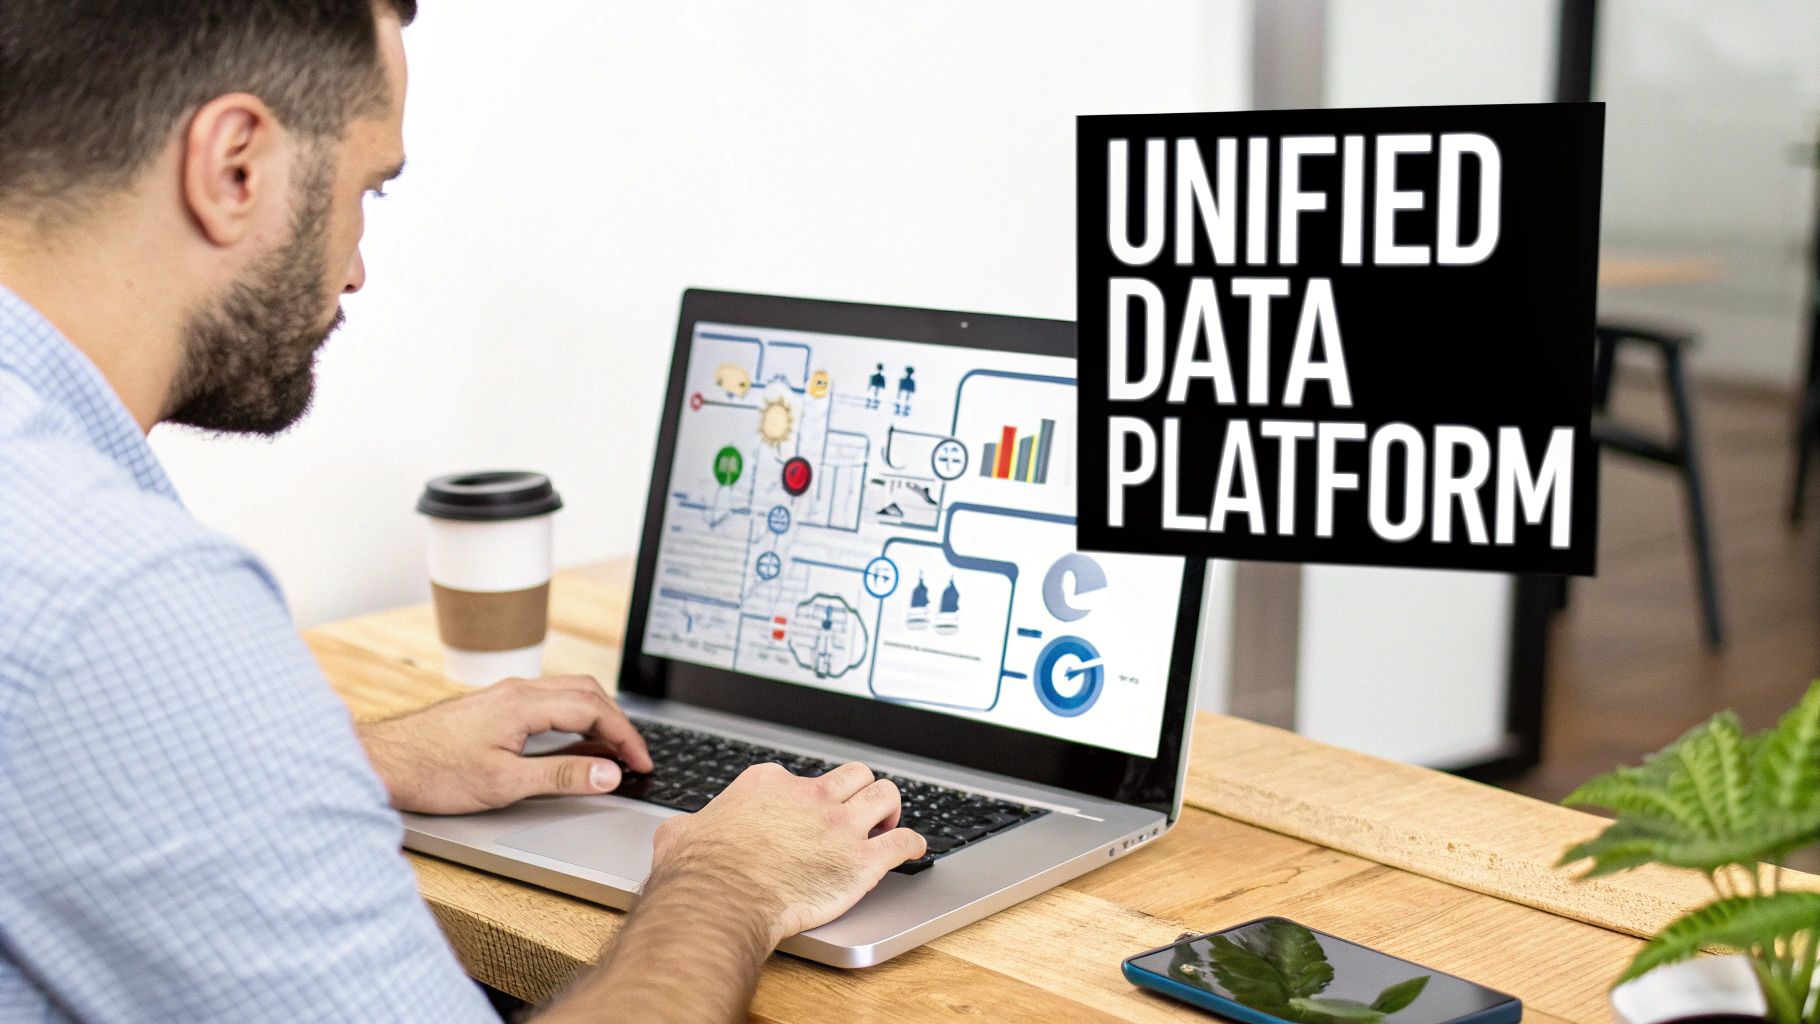
Building Your Modern Retail Data Platform
A modern data platform is the non-negotiable foundation for any serious retail BI initiative. It must be capable of handling the immense volume and variety of data your business generates daily.
This is not just a data repository; it's a high-performance engine that powers your insights. Legacy on-premise data warehouses cannot keep up with the constant streams of data from POS systems, e-commerce platforms, supply chain logs, and in-store IoT sensors.
The Power of a Cloud-Native Architecture
Cloud platforms like Snowflake are essential for modern retail. Their architecture separates storage from compute, allowing you to instantly scale resources to handle a Black Friday sales rush and scale back down to control costs during slower periods. This elasticity is impossible with older systems.
The primary goal is to establish a single source of truth. A modern platform consolidates siloed data—like sales and inventory—into a unified view, which is the bedrock of any reliable business intelligence strategy.
This diagram from Snowflake illustrates how various data sources flow into a central retail data cloud for analysis and action.
This architecture represents the critical journey from raw, disconnected data to unified insights that drive business applications and analytics.
Tracing the Modern Retail Data Journey
The path from raw numbers to actionable intelligence follows a clear, logical flow within this modern architecture, ensuring the insights are accurate, timely, and relevant.
- Data Ingestion: Collect structured data from systems like Salesforce and Shopify alongside semi-structured data like e-commerce weblogs. Specialized tools load this raw information into your central data platform.
- Storage and Transformation: Inside a platform like Snowflake, raw data is cleaned, modeled, and transformed. Business logic is applied here. For example, transaction records are joined with customer data to build a complete 360-degree view of purchasing behavior. Our experts often work with clients on optimizing time-series data with Snowflake for this purpose.
- Consumption and Visualization: The transformed data is fed into BI tools like Tableau or Power BI. This is where it becomes interactive dashboards and reports that business users rely on to track KPIs, spot trends, and make informed decisions.
This structured flow ensures that decision-makers across the organization work from the same validated, up-to-date information, eliminating confusion and aligning everyone toward common goals.
This architectural approach provides a scalable foundation ready for advanced analytics and AI-driven automation as your business evolves.
Moving from Insight to Action with Agentic AI
What if your BI system didn’t just tell you what to do but could execute the action itself? This is the next phase of business intelligence and retail, where Agentic AI eliminates the gap between insight and execution.
Standard BI is like a traffic alert on your phone—helpful, but you still have to find a new route. Agentic AI is the self-driving car that receives the alert and automatically reroutes, allowing you to focus on your destination.
Intelligent Automation in Practice
This is already a reality. Leading retailers are deploying AI "agents"—specialized software designed for specific tasks—that act on insights from their BI platform to boost operational efficiency.
Use Case Example: An AI agent monitors inventory and supply chain data, detecting that a product is selling faster than expected. Instead of sending an alert, it checks weather forecasts that might increase demand further and then autonomously adjusts a pending purchase order with the supplier. This proactive measure prevents a stockout without any human intervention.
Other real-world applications include:
- Dynamic Marketing: An agent identifies a group of customers with declining purchase frequency and automatically launches a personalized re-engagement campaign to win them back.
- Pricing Adjustments: An agent monitors competitor prices and inventory levels. When a rival discounts a key product, it instantly analyzes the profit impact and executes a counter-pricing move.
Agentic AI closes the loop between analysis and execution. It creates a system that not only thinks but also acts, transforming your retail operation into a responsive, self-optimizing machine.
Building a Self-Correcting Retail Engine
The ultimate goal is a retail ecosystem where data-driven decisions are made and executed at machine speed. When your BI platform identifies an opportunity or threat, an AI agent is already empowered to act on it.
This shift frees your team from routine operational tasks, allowing them to focus on high-level strategy and growth. The fusion of deep analytics and automated action is the foundation for the next wave of retail innovation, building an intelligent enterprise that adapts to market shifts faster than the competition.
Laying Out Your BI Roadmap
Turning this vision into reality requires a practical, step-by-step plan. A successful BI journey starts with a focused goal, proves its value quickly, and builds momentum. A phased approach minimizes risk and maximizes buy-in.
Start with a Data Audit
Before selecting tools, conduct a thorough data audit to identify high-impact opportunities.
Ask critical questions: Where is our most valuable data located? What are our biggest data quality challenges? Most importantly, which single business problem, if solved with data, would deliver the biggest win? This initial groundwork ensures your efforts are aimed where they will make a real difference.
Launch a Focused Pilot Project
With a top opportunity identified, launch a pilot project with a narrow, well-defined goal. For example, focus on reducing stockouts for your top 10% of products or optimizing marketing spend for a single campaign. This focused approach is designed to deliver a quick, measurable win.
A successful pilot is your best internal marketing tool. It delivers a tangible ROI, quiets skeptics, and builds the excitement needed to secure resources for a broader rollout.
Scale Strategically Across the Enterprise
Once you have a win, you have earned the right to scale. Methodically expand your BI capabilities to other departments and use cases, always tying each new initiative to a clear, measurable business outcome.
This roadmap transforms the powerful combination of a modern data platform like Snowflake and smart automation into a concrete reality. Partnering with experts who understand the nuances of both business intelligence and retail can be invaluable in guiding your journey from raw data to decisive, automated action.
Frequently Asked Questions
When integrating business intelligence into a retail operation, leaders often have a few key questions.
What Is the First Step in Retail BI Implementation?
The most critical first step is a data audit and strategy phase. Before considering tools, understand what data you have, where it resides, and its quality.
Select a single, high-impact business problem to solve, such as reducing stockouts for top-selling items or improving marketing ROI. This focus delivers an early win and demonstrates the value of a smart BI investment.
A common mistake is buying technology before defining the problem. A successful BI project always starts with a business challenge, not a software purchase, ensuring efforts are tied directly to a measurable outcome.
How Does Snowflake Differ from Traditional Data Warehouses?
The game-changer with Snowflake is its cloud-native architecture that separates storage from compute. This allows you to scale resources up or down instantly—essential for handling the data fluctuations of retail events like holiday sales.
Unlike rigid legacy systems, Snowflake easily handles semi-structured data like JSON files from weblogs and enables secure data sharing with suppliers, making your entire operation more agile.
Can Small and Medium-Sized Retailers Benefit from BI?
Absolutely. Cloud platforms have removed the old barriers to entry. With pay-as-you-go models, small retailers can get started without a massive upfront hardware investment.
Business intelligence and retail analytics empower smaller retailers to compete effectively. By gaining a deeper understanding of customer behavior, fine-tuning inventory, and personalizing marketing, they can achieve higher efficiency and profitability, leveling the playing field against larger competitors.


